
Welcome back readers. Hope that you had a good “summer” week and that the sudden shift from positive to negative in the markets did not catch you off guard. We will explore…

On all accounts, it has been a good 2024 in the market so far. Yes, by all measures, the markets have been narrowly traded, and unless you bought and owned the mega-cap technology stocks, you may find yourself well under-performing the major market indices.
As we have pointed out over the past few weeks, there is a major rotation going on between sectors of the markets. If you have not had a chance to read last week’s Weekly Outlook on the rotation going on, please go here to access the article.
Until this past week, it was an orderly movement from large-cap technology stocks (and anything even remotely related to AI) rotating into large-cap value-oriented sectors, which included financial, insurance and homebuilding stocks as well as into small cap stocks.
It is interesting to note that some tech related companies came out with earnings at the beginning of the week which attracted money to swiftly rotate back into tech stocks only to get smashed on Thursday and Friday.
If you were to study the past few weeks, you would recognize that money has flowed into beaten up, lagging stocks that may have gotten big buying for the mere fact that they present better intrinsic valuations and NOT necessarily because they have stellar earnings.
So far this year, the mega cap tech stocks have been printing money and only when the market realized that they were paying too high a price for the future earnings of these darlings, did momentum begin to shift. More on this in a few minutes.
A decidedly down week for the markets.
This was a bad week for most areas of the markets. The tech heavy NASDAQ (QQQ) continued its sell off which began in the middle of July. The hardest hit area this week was the small cap index (IWM) which gave back much of the past few weeks’ explosive rotation. The Dow Jones Industrial (DIA) held up the best as money continued to flow into mega cap value-oriented issues. The standout winner for the week was bonds as we saw the 10-year rates drop below 4%.
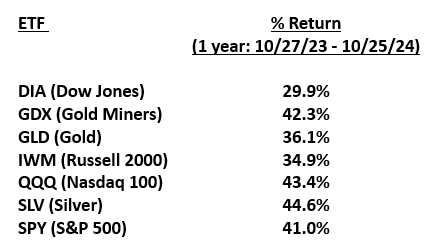
For those keeping tabs, here is the scoreboard for the different markets and asset classes:

It was a seesaw this past week. Wednesday was a huge up day in most of the above referenced markets followed by two ugly negative days unless you were a bond investor. Friday, by far, finished the week off in a negative fashion. Other than Apple, which had reported good earnings on Thursday evening, not much else was in the green. See below. (note the picture of Jerome Powell which we will get to in a minute).

The area hardest hit within Technology stocks were the semiconductor companies (chips). They have seen a negative downdraft since the middle of July. Then you had Intel report terrible earnings and a reduction in their dividend. That stock fell by 35% or more this past week. See below:

Perhaps given the appreciation in many Chip stocks, like Nvidia, AMD and ARM Holdings (and others) and the large profits people had from participating in the AI/Technology move up, the past two days triggered some panic selling. Goldman Sachs measures this and provides the chart below showing this past week along with similar periods.

Interesting to note that while money was coming out of technology stocks, some of it did find its way into more defensive areas of the markets in Utilities and of course the bond market. See graph below:

Bonds were the big winner last week as noted above. They had the biggest one week move in over a year. Most yields came down rather dramatically across all time periods. See charts below:


For institutional funds as well as many investors, including 401k participants, this type of sell-off in stocks and a rally in bonds is a natural way to rebalance portfolios. It was a great week for the 60/40 portfolio. $AGG/$SPY which jumped +4.25%, marking its best week since March 2023. However, this was a risk-off move, indicative of a flight to safety. That can have a dampening effect on the equity markets for some time. See graph below.

Equal weight indices really illustrate that it has been the few mega-cap tech stocks that have been driving the cap weighted index performance. We covered this in some detail last week. Proof of this is to compare the QQQ, currently still up 9.6% year-to-date against the equal weighted QQQ which is now down for the year. This shows the perspective that the average stock within the NASDAQ is down on the year. This is called a true “stock picker’s” market. See chart below:

I tripped on the below chart, which shows all too clearly just how extended the S&P 500 had gotten as compared to a typical positive, upward market that would normally have a different upward sloping trend. See chart below:

Interestingly, the below chart shows a current comparison of the S&P 500 to a similar period in 2022. You will notice the similar time and advance made by the index. This may provide some time clarity on the recent run. See graph below:

According to Ryan Detrick of The Carson Group, these kinds of sudden corrections are to be expected. This reminds us that occasionally that frothy and over extending markets need a corrective period of consolidation. See graph below:

Fear, uncertainty and volatility creep back into the markets
I had a past client call me late yesterday and ask “so what exactly happened to trip the sell-off this week”. I thought I could provide the answer to him through this commentary.
While we are in earnings season and so far, so good (which is why some selected stocks have been big recent winners), deteriorating economic numbers this week hit the market hard.
The ISM numbers show the fourth month of contraction
On Thursday morning the Institute of Supply Management released their July number, which came in at 46.8, well below expectations. This was down 1.7% from the previous month and well below the important number of 50. Below 50 shows that the economy is shrinking. Economists polled by the Wall Street Journal had forecast the index to rise slightly last month.
This is a key barometer of U.S. factories. This number now hit an eight-month low, a clear sign that an ongoing slump in the industrial side of the economy has deepened. “U.S.” manufacturing activity entered deeper into contraction” said Timothy Fiore, chairman of the ISM survey. “Demand remains subdued, as companies show an unwillingness to invest in capital and inventory due to current federal monetary policy and other conditions.”
The markets did not like this news and sold off hard on Thursday as bonds began to rally factoring in a future reduction in interest rates by the Federal Reserve.
The Jobs Report
This was followed on Friday by the highly anticipated jobs report. The Bureau of Labor Statistics reported before Wall Street opened that the US only added 114,000 new jobs. This was a huge miss as most of the economists and analysts expected 175,000 new jobs. From the chart below you can see that the trend in hiring has been trending sharply down.

Additionally, June’s job creation of 206,000 new jobs was revised downward to just 179,000 jobs. This was the lowest published number since December 2020.
These downward revisions by the BLS, as shown in the next chart, show that 5 of the last 6 months job creation has been revised downward. See chart below:

And jobless claims are beginning to pick up. Initial claims jumped 14,000 to 249,000 versus an estimated 236,000, the highest in nearly a year. Continuing claims surged by 33,000 to 1,877,000, the highest since November 2021. See chart below.

Has Jerome Powell and the Federal Reserve waited too long to lower rates?
Some believe so after the numbers came in this week (and prior weeks) showing a more dramatic slowdown than expected. Many believe this recent run of bad economic data, especially three months of declining new employment, coincides with Powell’s decision to keep rates on hold at 5.5%.
Given the weakness in economic numbers, many believe the Fed will certainly be reducing interest rates by September. There is also talk that the cut should (or may) be a 50 basis point cut instead of the 25 basis points that the market has been expecting.
WAIT, I can hear you thinking….
If interest rates may be coming down, then why would the stock market contract like it recently has?
Good question. My answer would factor in the following points:
- The prices of many leading mega-cap stocks have been stretched and earnings may not support the current multiples.
- These stocks needed to take a breather. Some had been going up in parabolic fashion. Stocks never go straight up without correcting.
- Too much investor (retail) enthusiasm and bullishness. It is a contrary indicator.
- People were primed to take profits off as soon as they saw weakness. As we have shown in the past few months, the number of retail investors is at multi-hear highs on participation. They have quick triggers and were likely to “sell” and take profits when they saw the first moment of weakness.
- Institutional corporate buying has been slowing down and may be done for a while. This may reduce some big institutional money flows.
- Fear of an impending soft economy is beginning to weigh on the markets.
- Earnings are volatile and some companies are reporting disappointing sales and revenue numbers and/or forecasting lighter earnings in the future.
Another reason for Friday’s big sell off was the fear that we may be heading into a recession.
Now that the real payroll numbers have been released showing the past few months much worse than expected, it triggered the Sahm recession indicator. This indicator is named after Claudia Sahm, a Fulbright scholar and Federal Reserve Economist. The indicator is based on unemployment rates rising. When you get three months of rising unemployment numbers, such as we have just had, you are getting close to a recession.
For those who wish to understand it better. Here is the rule: IF the unemployment rate (based on a three-month moving average) rises by half a percentage point from its low of the past year, then the rule is triggered. And right now the unemployment rate has surged 0.6% from the year’s low. See chart below:

Ms. Sahm, for her part, says she thinks this time might be different and we are not in a recession. However, she did acknowledge that the economy is not moving in the right direction. Fed Chairman Jerome Powell believes that the Sahm rule is playing little significance right now and that we are finally seeing a normalized labor market.
The idea that we could see a recession because of the rapid rise in unemployment has, for now, spooked the market and pushed interest yields lower.
Why you should not sell stocks, yet!
August 1st started the worst two months and seasonal period to invest in the markets. This typical seasonality period should remind investors to remain cautious and potentially defensive. However, we are also in earnings season, and so far earnings look good.
Earnings update:
According to FactSet, 75% of S&P 500 companies have reported their Q2 2024 results with 78% beating their earnings estimates and 59% reporting revenues above estimates.
59% revenue beats is less than the prior two quarters of 2024. We suspect it has to do with the continual rising costs of raw materials, labor and transportation. Also, consumers have started to contract their spending on certain goods which means they are buying less or buying “down” in their brands and making tougher decisions about what is a “need” and what is a “want”. That is having a softening effect on company’s revenues.
Earnings season volatility.
This has been the most volatile earnings season since the financial crisis. This is creating jitters among many institutional investors. See chart below.

We have pointed out in numerous Market Outlooks over the past year that bear markets do not begin when corporate earnings are this good. The S&P 500 corporations are currently growing their earnings by an average of 8-9% per year. When earnings growth is this solid, it is not a time when the markets would typically begin a bear market.
The saving grace of the latest earnings reports.
One of the reasons we think the stock market could move higher in the near future is due to fact that earnings remain healthy and profit margins continue to rise. This ongoing profit story will keep the S&P 500 in the “buy-the-dip” territory. See charts below showing the margin resilience of the markets.


We suspect that any correction might be shallow and over quickly, especially given that this is an election year and August-November in election years tends to be positive. (go back and review recent Market Outlooks to see what the election cycle looks like).
Really. “Buy-the dip”?
According to Ned Davis Research, there are times when the SPY fell by 3% or more while ETF inflows were increasing. This is a “buy the dip” moment. See chart below:

Seasonality
As we said above, August (and September) is not typically a good time to invest in stocks. But there is a catch. Stocks have historically done quite well in election years in August. We call your attention to the final chart below which may help you decide to not to get too defensive in your own portfolios.

To summarize, it may not be helpful or necessary to get too defensive during this upcoming 3-month period (pre-election). Remember the following:
“If you’re not grateful, you’re not rich,
no matter how much you have.”
- John Templeton
Thank you for reading. Have a good beginning to August and enjoy the dog days of summer.
More By This Author:
The Rotation Continues & One Sector Has Helped Fuel This Rotation
The Beginning Of A Stock Market Summer Storm? Or Just A Passing Shower?
Is The Fed Going to Cut Rates Soon? Guess Who Thinks So.

Comments
Log in or sign up to join the conversation.