
The Beginning Of A Stock Market Summer Storm? Or Just A Passing Shower?
Welcome back readers. Glad you are joining us.

I began the week traveling to Chicago for a meeting. For those of you unaware, my son, Zach, works for our asset management company, MG Asset Management. He lives and works in Chicago. He had called me on Monday to tell me about the incredible weather that occurred in Chicago on Sunday night. Not sure it had ever happened before, but lightning hit the three highest buildings in Chicago simultaneously.
Maybe it was a preview of what was to come in the stock market during the upcoming week.
The stock market continued its most recent rally and euphoria in technology stocks on Monday and Tuesday of this past week. Two distinct market moves occurred on Monday and Tuesday that attracted investors’ attention. The Dow was up over 2% and small cap stocks continued their thrust higher, up over 5%. That followed the previous week’s historic move in small cap stocks.
The S&P 500 and the NASDAQ 100 (QQQ) were up but less than 1% for the Monday-Tuesday rally. If you haven’t reviewed last week’s Market Outlook as yet, you may go here to review (or reread) the commentary on the historic move of small-cap stocks.
The markets turned on a dime Wednesday-Friday.
Wednesday, the market felt the beginning of a summer storm. There were several reasons that the talking heads and Wall Street analysts gave why the market sold off. These included geopolitical commentary on whether the US would support Taiwan if they were attacked by China. This also led to additional commentary as to whether Taiwan Semiconductor could retain its lofty valuation if it was wiped out in a Chinese attack of the island. Dire thoughts.
Additional questions were raised related to the possibility of a change in the White House administration (Democrat to Republican) and the impact that might arise from tough tariffs, especially on the technology industry. I also think that the uncertainty surrounding whether the current President is fit to run has had a negative effect on the market.
To summarize just how negative Wednesday’s move in tech stocks see the heat map below:
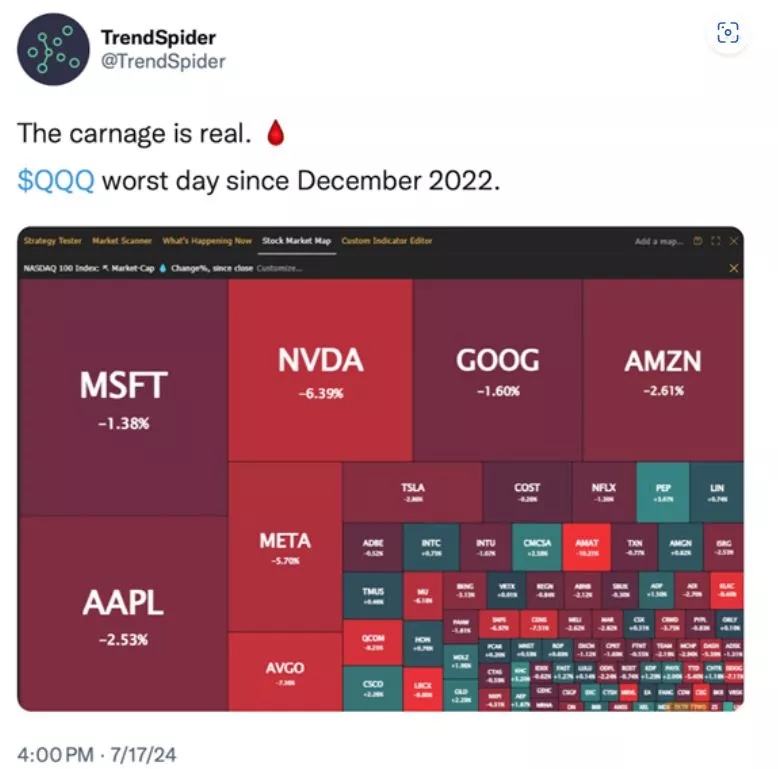
Technology stocks, especially semiconductor issues over the past 10 months have been on a tear. You will also recall that two weeks ago I mentioned that the best month of the year to invest in the broad market is July. However, historically, most of the return comes in the first half of the month.
Wednesday’s tech sell-off continued for the rest of the week. Instead of the positive returns of Monday and Tuesday, the tech heavy NASDAQ 100 (QQQ) stocks were down 5% in the last three days.
Is this just a passing storm or more serious?
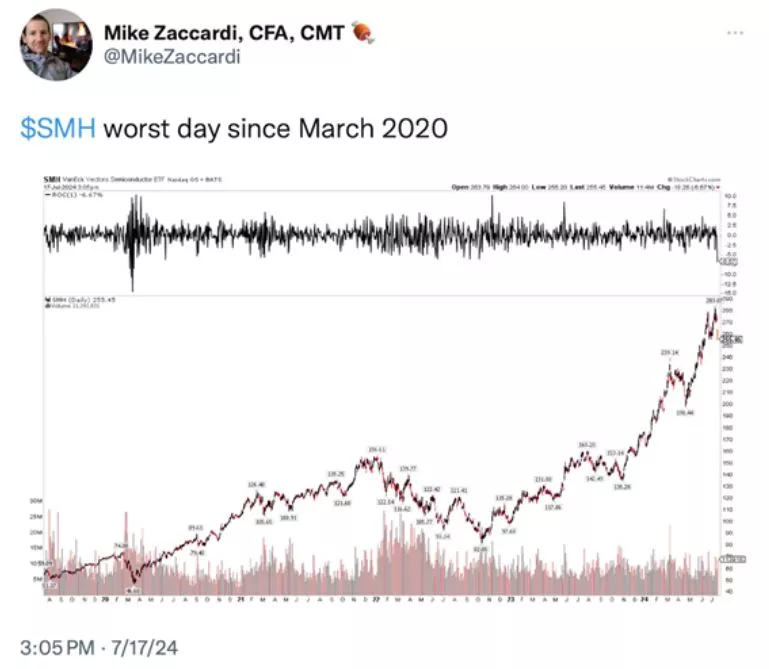
The week felt like a hurricane to some. A lot of key stocks, especially chip stocks, dropped hard. Nvidia was down over 8%, Meta, Alphabet and Amazon all dropped 5% or more. Apple, Tesla and Microsoft…all down on the week. See the semiconductor chart below:
The Friday cybersecurity shock.
Even though the geopolitical rhetoric had started the tech sell-off, nobody was prepared for the Crowdstrike fiasco that hit on Friday. This started from a disastrous software update which prevented the Microsoft Windows operating system from working around the world. Millions of businesses, including the transportation sector and healthcare (hospitals had to suspend important surgeries) took the brunt of the problem.
The volatility index or “VIX” soared 32% this past week into elevated territory, triggering nervousness from years of dealing with back-to-back investment shocks. This was the worst week on Wall Street since April, if you can believe that. Just 90 days ago, we will remind you, the market snapped back quickly and went on to new highs in May and June.
At the end of the week, here is what the indices looked like:
It is important to remember that we are in an election year with newfound uncertainties. We are likely to feel additional turbulence and geopolitical risk with the potential of a new administration and/or what might happen with the current President and his administration.
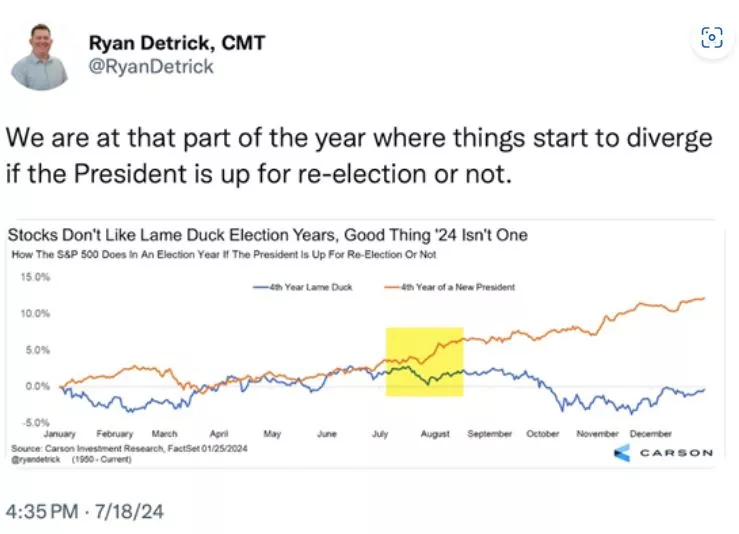
We also find ourselves at that part of the year when the market begins to have divergences. See chart below:
Will the Fed lower interest rates?
Much of the market’s recent exuberance has certainly been tied to the belief that the Fed may cut interest rates as soon as the September meeting. We covered this in last week’s Market Outlook.
Most economists now believe that short-term rates are too high as compared to the rate of inflation which continues to trend down (see chart below):
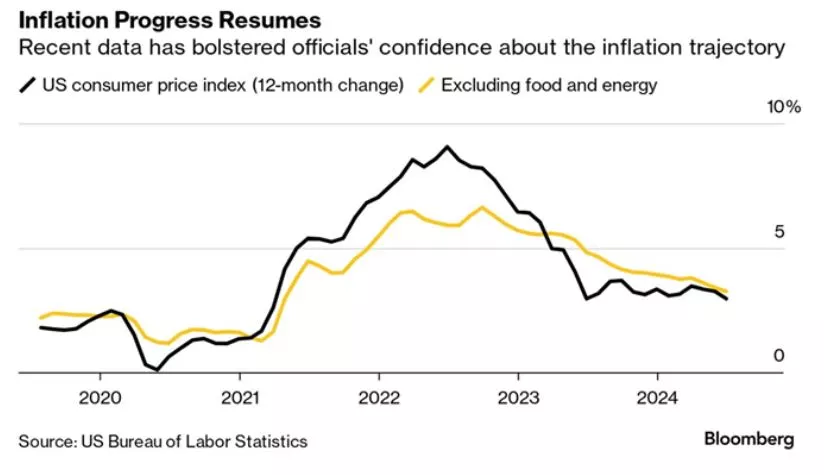
For more than two years now, inflation has eclipsed everything else at the US Federal Reserve. The US central bank appears ready to cut interest rates and the futures betting pool is showing an almost 100% chance of that happening. This and expected good earnings have been driving a lot of the recent gains in the stock market.
Additionally, the business community, especially commercial real estate, mortgage brokerage, home sales organizations and homebuilders believe rates are too restrictive and continues to put their businesses into a stand-still. They have been pleading for lower interest rates. I also suspect that the current Administration understands the value of driving a soft (not hard) landing and has also been secretly pleading for lower rates.
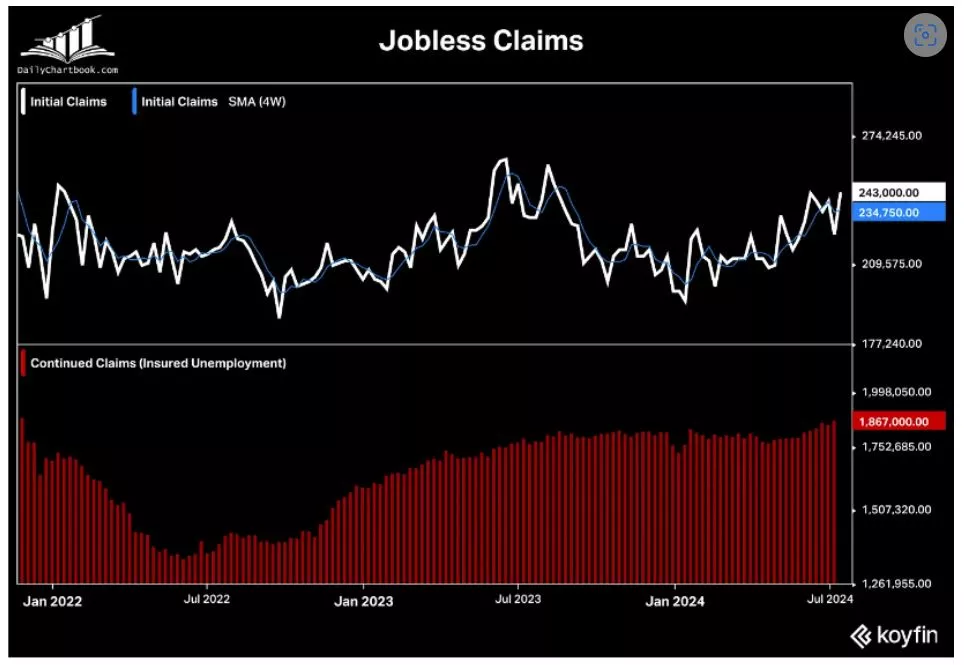
Another factor is that the Fed has been closely watching and may be an important catalyst for them to make the ultimate decision to lower rates, is the employment market. Given recent softening in the job zmarket, this may provide additional fuel to give them the runway they need to begin lowering rates. See chart below:
Signs of softening in the labor market as both initial and continuing claims rose more than expected in the week ending July 13. The former tied a YTD high while the latter hit the highest since November 2021.
It is not a done deal that the Fed lowers rates before year end, even though the futures markets are suggesting that. Fed officials still want to see monthly price numbers continuing to trend down towards the 2% annual inflation goal before they commit to lowering borrowing costs from a two-decade high.
I truly believe in the end however, that the Fed Chairman and his colleagues remain dovish and want to do everything possible to avoid the US economy from a potential hard landing. That is something they could take credit for in the years ahead.
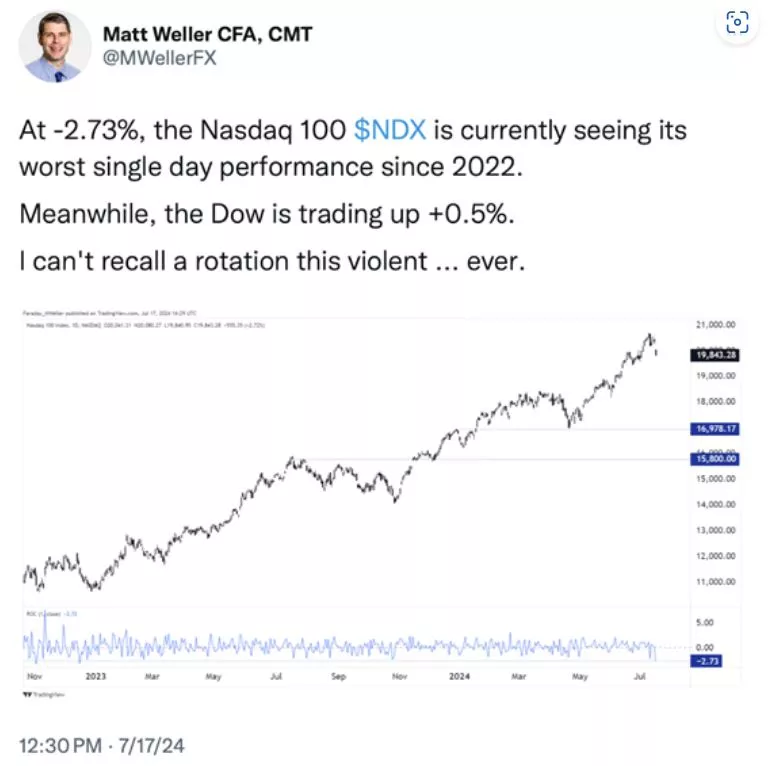
Rotation has kicked in.
While technology stocks and the S&P 500 too had a tough week, money was rotating out of large tech stocks and found its way into mega-cap value stocks (some of which are in the Dow), and small-cap stocks. The large-cap value ETF, VTV was positive for the week, up 0.47% and the large-cap growth ETF, VUG was negative for the week down -3.87%. This was a significant material rotation that took place. But will it last?
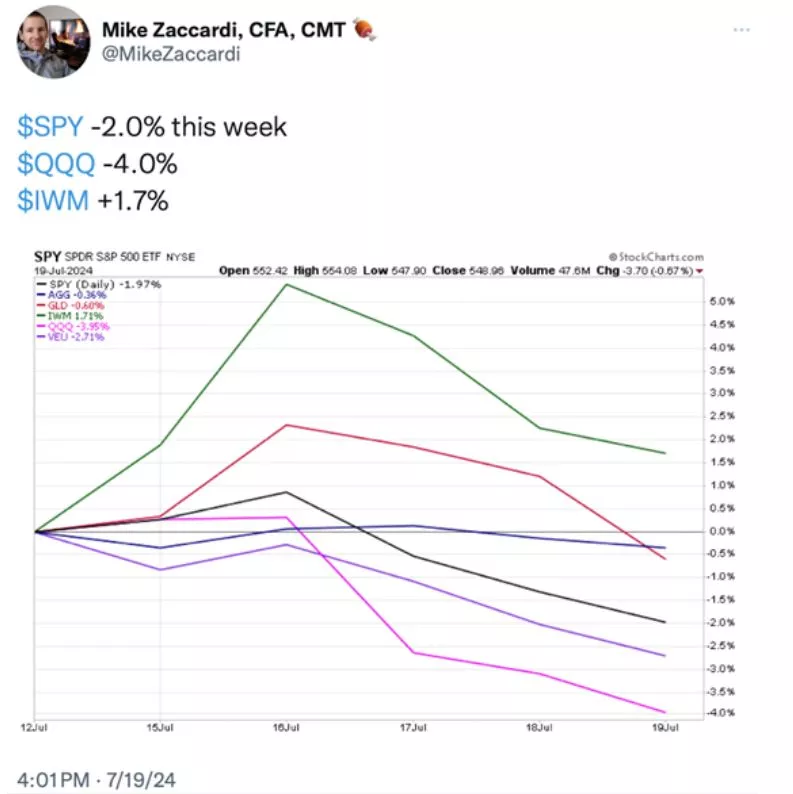
For the week, the S&P (SPY) was down about 2%, the NASDAQ (QQQ) down about 4% but the Dow Jones (DIA) was up on the week (0.66%) and small-cap stock advanced another 1.74%.
The Dow did give up some of its historical setting advance but still managed to overcome another major new all-time high and hurdle. See below:

The rotation became even more evident beginning on Wednesday. See chart below:
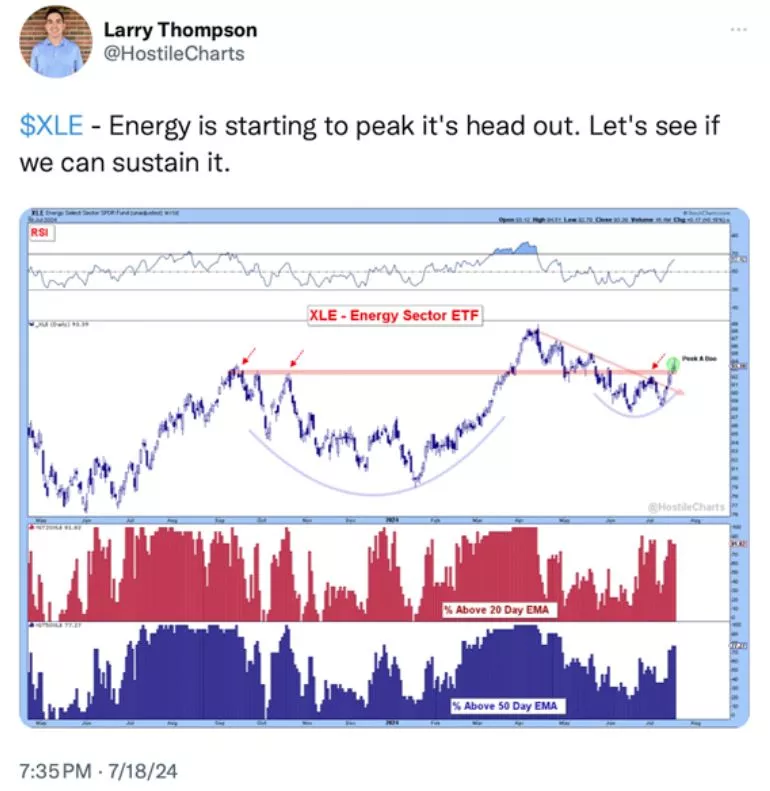
I have been reading more frequently lately about the beginning of a growth to value shift as the expectations of lower interest rates has begun to provide a tailwind for the financial (regional banks, money center banks, credit card companies and REITs) stocks and sectors. Additionally, there has been talk this past week about more drilling and energy development in the future if there is a change of administration. This has helped lift energy related stocks off their recent malaise. See chart below on energy:
The continued case for small and mid cap stocks.
Again, I tried to make the case last week as to how and why small-cap stocks may be starting a period of outperformance. I suggest you go back and review (or reread) it if you have not yet.
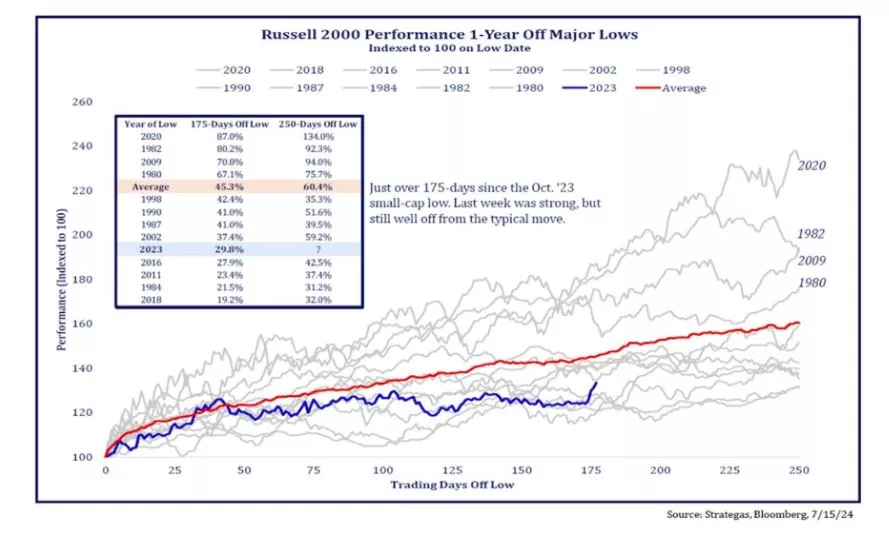
To summarize, the prospect of lower interest rates is often the catalyst for powering small cap stocks higher. Small cap stocks have been stuck in a trading range for quite a long time and this sudden move higher (breakout) was not unexpected. See the trend in small-cap stocks typical after this type of a sudden move:
- After breaking out earlier in the week to a two-year high on Monday, small caps pared their gains late last week but still ended up the week 1.67%
- After surging 11.5% in just five days, the RSI reached its most overbought level since 2017. Therefore the 3.5% pullback was quite mild.
- The small cap index broke out above 2100 and retesting that index would be healthy. On the other hand, violating 2100 would invalidate the breakout.
In conclusion: The momentous breakout in Small Caps fizzled out throughout the week, with the Russell 2000 giving back over half of its intraweek gains. This has been a healthy pullback but violating 2100 would be unhealthy.
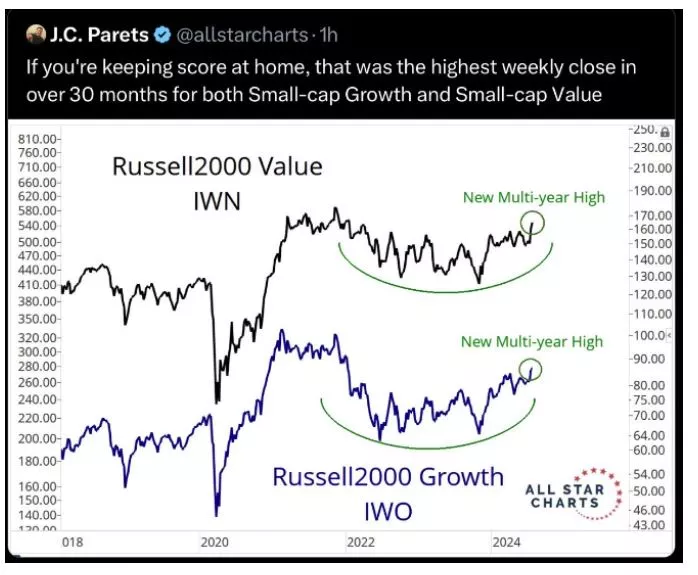
Yet, most investors are not aware of just how powerful and potentially long-lasting the rotation into small cap stocks can be. See the chart for the Russell 2000 (small cap index) Growth and Value indices below:
Divided perspectives from Wall Street.
You may want to go back and review the many charts and graphs from earlier 2024 Market Outlooks. I suggest that you pay particular attention to the charts from Ryan Detrick of The Carson Group, that shows what happened in other years (especially election years) when the stock market had a good first half of the year. The returns going forward for the second half of the year have, historically, been quite good. This further implies that we may have a way to go in this current bull market.
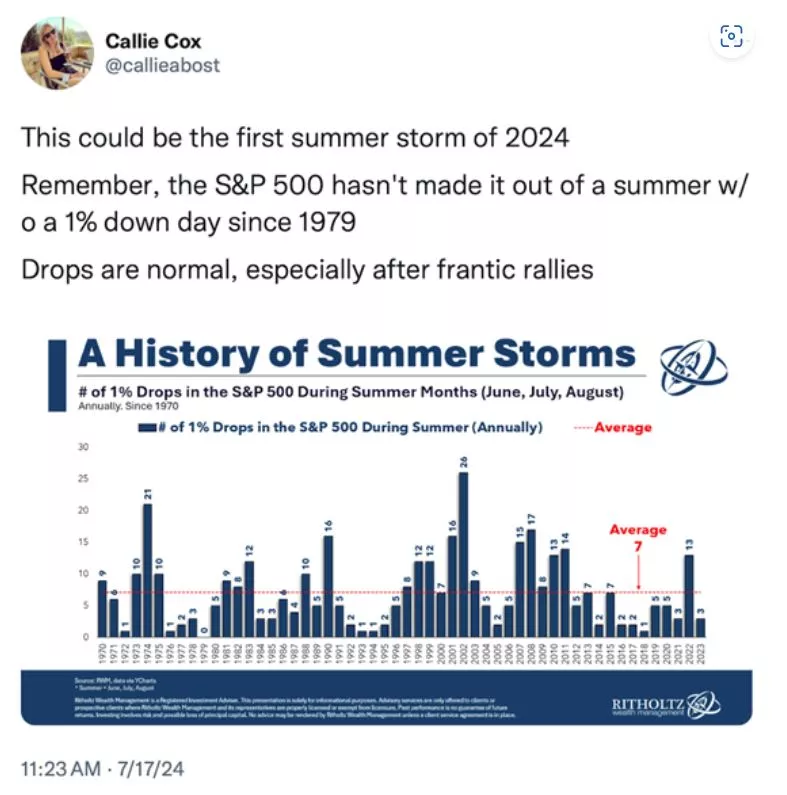
It is also important to understand that the summer months (August through October), tend to be the underperforming months. The summer months and then going into the fall, have typically been periods we have experienced more frequent storms. See chart below:
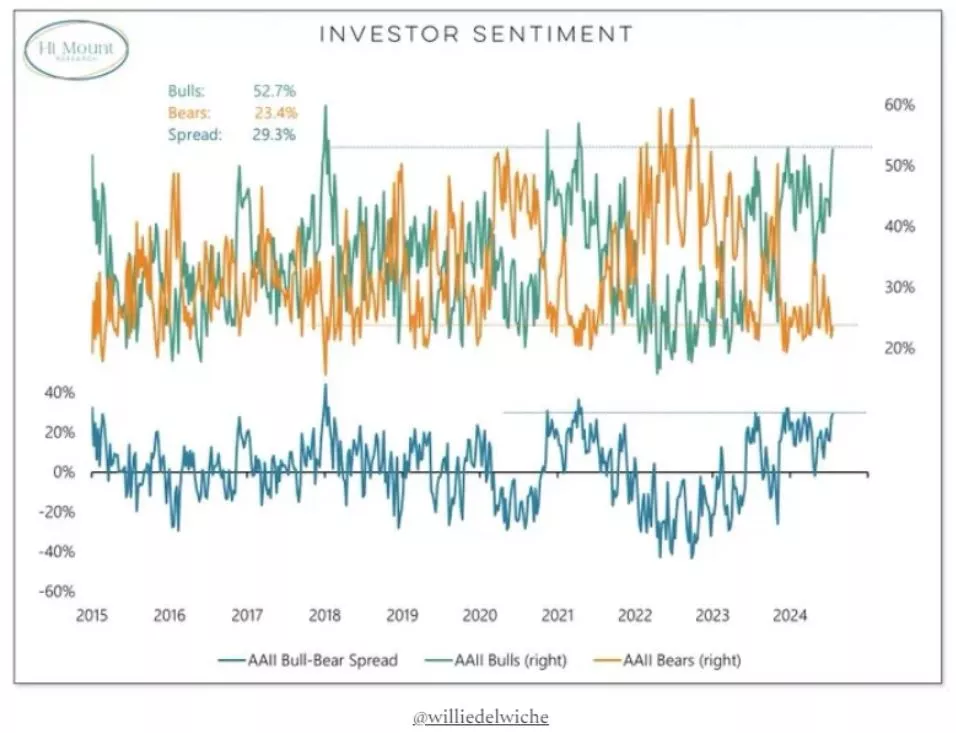
Something to keep in mind is that investor sentiment (from AAII-American Association of Individual Investors) remains high and this often helps keep the market on positive footing. See the AAII chart below:
Retail investor sentiment. "AAII bulls up to 52.7% - highest level of this year and 2nd highest level since early 2021. Optimism is elevated, but risks become more acute when the crowd heads for the exits."
I hope I have provided you a positive glimpse into the bullish case for stocks along with the healthy recent rotation and emergence of the Dow (a more value based index) and Small-Cap stocks (market broadening out). However, there are plenty of pundits on Wall Street who have a different, more negative opinion. I read their information every week. Right now, one such strategist is Scott Rubner of Goldman Sachs who shared this just a day or two ago:
“The S&P 500 Index has nowhere to go but down. So says Goldman Sachs tactical strategist Scott Rubner, who cautions “I am not buying the dip.” That’s because today has historically marked a turning point for returns on the equities benchmark, the Goldman global markets division managing director said, citing data going back to 1928. And what follows, of course, is August—typically the worst month for outflows from passive equity and mutual funds. Weak seasonality, stretched positioning and with all the good news already priced in, the index is on the precipice of a summer correction. It’s a view Goldman’s trading desk has been leaning into since at least early June”
In conclusion.
Be careful not to get overly exuberant with your risk taking.
"Successful investing is about having people agree with you... later."
- James Grant
More By This Author:
Is The Fed Going to Cut Rates Soon? Guess Who Thinks So.Will The Winning Trend Continue?
Here Comes July. Historically the Stock Market’s Best Month of the Year!


