

Glad to have you back. In some respects, this past week in the stock market was monumental on several levels. But first, an important economic update which fueled the history making week.
Earlier in the week, the all important CPI (Consumer Price Index) was released for the month of June and came in lower than expected. Inflation fell 0.1% in June, which was lower than the expectations of a flat to positive 0.1% number. For the trailing 12 months the CPI came in at 3.0%.
Excluding volatile food and energy costs, the so-called core CPI increased 0.1% monthly and 3.3% from a year ago. The annual increase for the core rate was the smallest since April 2021.
These numbers hit the lowest levels in more than three years and demonstrated, yet again, that the trajectory for inflation measured at the consumer level, continued to decline. While not yet at the Fed’s 2% long-term target, this was enough of a decline to fuel speculation that the Fed now has room to lower the overnight lending rate. Most Wall Street economists now expect that to take place at the Fed’s early September meeting. See the latest futures predictions for an upcoming Fed Fund rate cut below:
Fed fund probabilities. Fed swaps are pricing a 93% chance of a Fed cut in September, up from 53% a month ago.

Lower CPI fuels a big rally in stocks.
After the news on Wednesday, the stock market celebrated as the S&P rocketed higher by 1.0% and closed above 5600 for the first time, cementing another new all-time high yet again.
Friday, the PPI (Producer Price Index) came out a touch hotter than expected, but did little to dampen the already jubilant feeling that stocks could and should go higher. The S&P closed up 0.69% higher Friday.
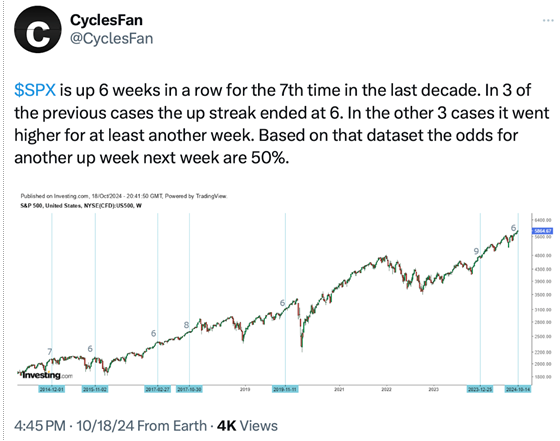
For the week, bond yields declined and the S&P 500 (SPY) was 1% higher on the week. The S&P printed a new all-time high for the second consecutive week. Also, the S&P has now closed higher in 10 of the last 12 weeks with a large number of new all-time highs hit along the way.
Improvement in the Advance-Decline line.
Perhaps the biggest improvement investors wanted to see was the expansion of a positive market breadth of the S&P. The NYSE Advance-Decline line broke out to an all-time high for the first time in two months on Thursday.
This breadth indicator often leads the S&P 500 higher or lower. It had peaked in May and pulled back while the S&P 500 made new highs, forming a negative breadth divergence which concerned many analysts on Wall Street. This week’s breakout eliminates that bearish divergence. See chart below:

New highs, new lows also improved. Another positive sign that investors were waiting for.
This is an important indicator that goes into the formulation of one of the MarketGauge core equity models. If you would like more information on this model or the two engines we use to configure a “risk-on or risk-off” posture, please reach out to us for more information. See the multi time period chart below:
New highs-lows. The number of stocks making new highs relative to new lows is expanding across multiple timeframes.

In the Market Outlook columns the past few weeks we have touched on why July is the best month of the year to invest in the stock market (S&P 500). More importantly, we continue to provide empirical historical evidence that during an election year, the stock market (S&P 500) does better. This is a seasonal bias not seen in the other 3 years of a Presidential cycle investment period. If you have not had a chance to review the last two week’s Market Outlook detailing the positive bias of July, please click here to go to the last two week’s articles.
See the chart of the positive bias of the S&P 500 stocks as compared to the index after last week:

Dow Jones Industrial Average (DIA) and NASDAQ 100 (QQQ) also look healthy and their positive bias should continue:
While the NASDAQ 100 and tech stocks had a flat week, tech stocks still look healthy and continue in their positive ways. See charts below:

DOW 40,000. See chart below:

The interesting paradox, was that the Nasdaq 100 (QQQ) closed down slightly (-0.27%) last week. Investors are starting to grow cautious toward higher flying and expensive tech stocks (based on P/Es). Many of the biggest mega cap stocks, (tech and consumer discretionary stocks) make up the top 50 stocks in the S&P 500 index. As evidenced below, they are selling at a high premium to the remainder of the 450 stocks in the index. See chart below:
The top 50 vs. bottom 450. The largest 50 stocks trade at a 30% premium to the bottom 450.

Earnings season will be a main driver if the markets can continue higher.
As we enter the all important 2nd quarter earnings season, it is crucial that many of these high flying tech stocks (as indicated above) are able to meet or exceed their lofty earnings expectations. See chart below:

Additionally there was a slight value tilt in large cap stocks as the large value ETF (VTV) was up 2.5% and the large growth ETF (VUG) was down slightly for the week (-0.33%). See illustration below:

Small-cap stocks shine. They made a historical move this past week as money rotated out of tech/mega cap growth stocks and into small-cap stocks.
Time and time again in our last few months of Market Outlook columns, we have pointed out that the minute investors think they are getting ready for the first interest rate cuts, the small-cap market would likely perform much better, if not lead the way.
With the 90%+ bet (seen Wednesday after the release of the CPI) that we will see an interest rate cut in September, the small-cap Russell 2000 index (IWM) made an unprecedented and historic move as it blasted higher and was up over 6% on the week. See chart below:

The move was even more impressive as small-cap performance versus tech stocks was one for the history books. See chart below:

We have consistently commented that we would likely see this type of move coming as soon as the Fed indicated they were getting closer to a “rate cut”. With the CPI information this past week, the futures betting (with swaps) and bond yields jumped to these expectations.
It is important to note that smaller companies are much more dependent on borrowing costs to build and advance their companies. These smaller sized companies are the biggest beneficiaries of an interest rate reduction and a decline in overnight lending rates. It is also important to note that many financial firms, especially regional banks, that deal with home mortgages, lending, and direct business financing involving smaller companies, also benefit from a pickup in business when rates decline. Therefore, it was not surprising to see the tilt to value stocks and away from big cap tech.
Is this a new rotation on which we should take action or just a snapback rally from a long underperforming consolidation in small-cap stocks?
Only time will tell, but we have been pounding the table that as soon as the market believed rates could/should fall, money would rotate into smaller capitalization stocks. We suspect that asset allocation decisions are beginning to consider a larger allocation to small-cap stocks. This was the week this theory may have been tested.
We now turn it over to Keith and his team for the important BIG VIEW bullets and video. Makes sure you catch Keith’s video as he will explore in more detail the small-cap rally and where we are with the current health of the market.
Thank you for reading. Wishing you an enjoyable summer week and good luck in your investing.
More By This Author:
Will The Winning Trend Continue?Here Comes July. Historically the Stock Market’s Best Month of the Year!
Can The Bull Market Keep on Kicking? Or Is It Growing Tired? The Answer May Surprise You!

Comments
Log in or sign up to join the conversation.