
It is a US and Canadian holiday on Monday, Sept. 5, which means no stock trading.

Image Source: Pixabay
US and Canadian stock indices are declining, and most of the market health Indicators have turned negative. Be cautious with deploying capital on the long side. If there are any quality trade setups I see, I will invest only a small amount of capital. In these conditions, I don’t want a lot of my capital exposed.
How the Market Indexes are Doing
I look at 4 different US indices because they each tell a different story about overall stock market health. The stock market is healthiest—and swing trading stocks on the long side is most profitable—when all these indexes are in uptrends. Here’s what each of the 4 indices represents:
- Nasdaq 100 – Tech stocks.
- S&P 500 – Large US companies.
- NYSE Composite – A wide array of stocks, varying in size and industry.
- Russell 2000 – Smaller companies.
2 Canadian stock indices are also included. The Composite tracks larger companies, while the Venture tracks very small companies.
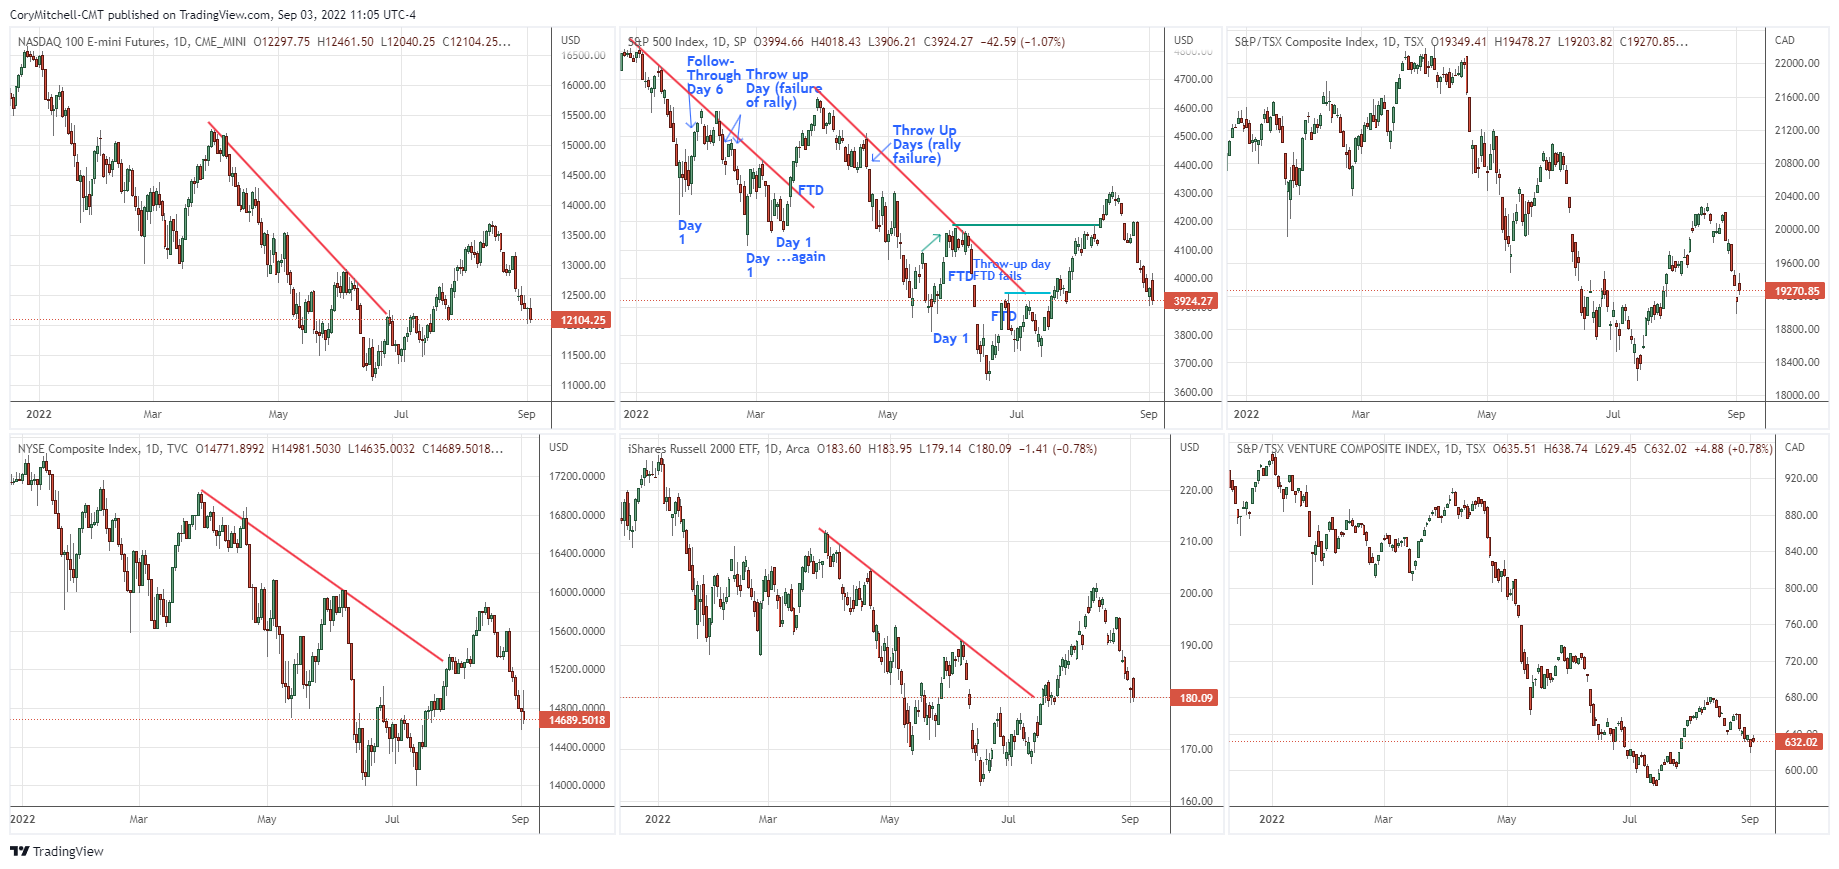
Charts are provided by TradingView – these are charts I personally use.
The indices are all experiencing pullbacks within a short-term uptrend. I never assume to know what will happen. This pullback could turn into a big decline, or the price could chop around or move higher again.
But at the moment, the selling pressure is on. I am still scanning because the market can turn around quickly and I want to have my stock watchlist ready. But as mentioned previously, I am not deploying much capital on long trades due to this overall market weakness.
State of the Market Health Indicators
The following chart shows the market health indicators I track. They tell me the condition of the stock market overall, and whether it’s a good time to swing trade individual stocks.
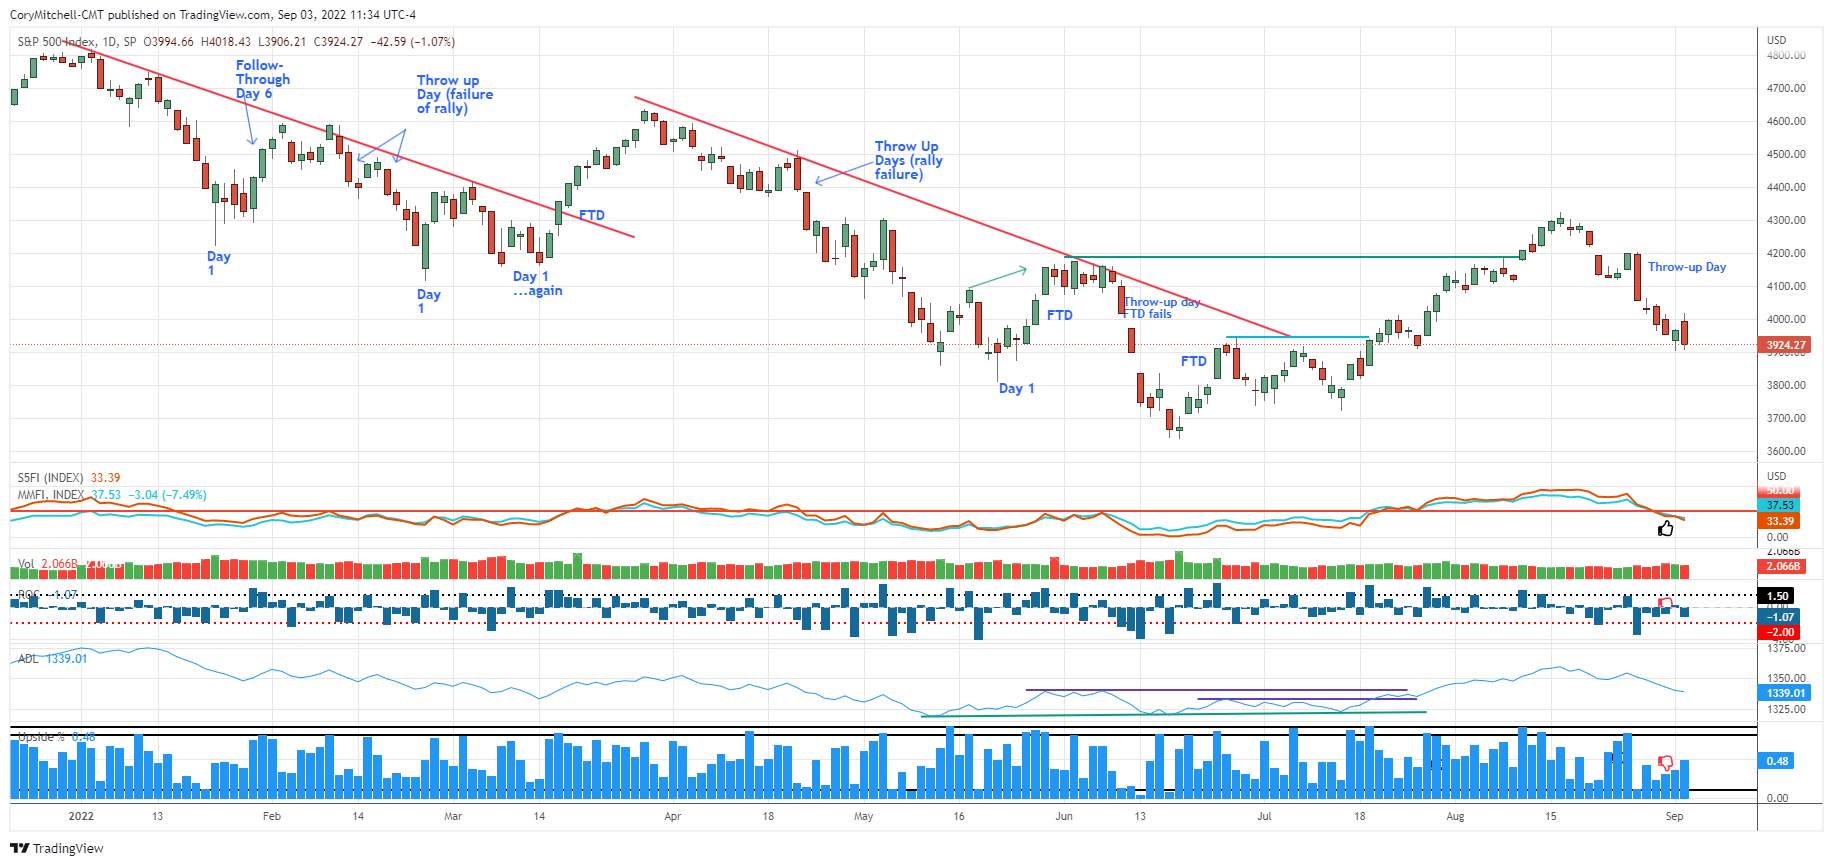
The market health indicators are poor.
- 33% of S&P 500 stocks are above their 50-day respective moving averages. 37% of all US stocks are above their respective 50-day moving averages. It’s generally much easier to swing trade profitably (on the long side) when more stocks are above their 50-day averages. When this indicator is below 50%, it tends to signal sideways movement or a downtrend for most stocks/indexes. This is a poor indicator.
- Volume was relevant on June 24 when it increased with the 3% price rise to create a follow-through day. A big drop on high volume on Aug. 26 is what I call a throw-up day. This often signals a further short-term decline - which has unfolded.
- The dark blue bars are the daily percentage movement of the S&P 500. Big moves are associated with downtrends and turning points. Small values are associated with an uptrend. Values of -2 are a warning sign anytime they occur. A more than 3% drop on Aug. 26 occurred, and this is a poor indicator.
- The blue line is the cumulative NYSE Advance-Decline Line. It moved above its early April high before the S&P 500 moved above its April high. That is a bullish divergence and signals that the S&P 500 is likely to reach the April high before a new low. The indicator also stayed above April 9 levels, while the S&P 500 fell below its April 9 level. Recently, the indicator has weakened. This is a decent indicator.
- The blue columns are NYSE up volume divided by NYSE total volume. It tracks buying and selling enthusiasm. There were 91% upside days on July 19 and Aug. 10. That’s bullish. But there also was a 90% downside day on Aug. 26 (manually calculated). That’s bad.
- The ultimate indicator is how many quality setups there are and how trades are working. Over the last couple of weeks there hasn’t been many stocks I am interested in, and even fewer stocks have triggered and gone anywhere. This is to be expected, with most stocks dropping the last couple weeks. This week, my scan list was pretty small again. That’s not encouraging and naturally keeps capital deployment low because there just isn’t much to trade.
Sectors on the Move
Everything took a hit last week; every sector was down. Energy is the only sector that has been in the green over the last month. There was a strong rotation into utilities and consumer defensive stocks. These tend to fair a bit better in weak market environments (though they still drop, just not as much).
Over the last three months, consumer cyclicals, industrials, healthcare, and technology have been the top performing (non-defensive) sectors.

Sector performance provided by Finviz.
What I’m Doing Right Now
I’m scanning and taking stock swing trades when I get setups. But as mentioned, I have been limiting capital deployment based on the recent drop. I view the drop as healthy though, as it will create a lot more quality swing trades going forward.
More By This Author:
Swing Trading Stock Market Outlook For The Week Of Aug. 29Seasonal Patterns Of The Stock Market
Stock Market Health Update For The Week Of Aug. 1


Comments
Log in or sign up to join the conversation.