
Stock market seasonal patterns are the directional tendencies of stock indices based on the time of the year. Certain times of the year tend to be more bullish (go up) for stocks, while other times during the year are more bearish (go down).
Seasonality is essentially an average, based on history, of how the stock market tends to perform throughout the year. Averages are a guide, a tool, but don’t forecast with accuracy what will happen this year. That said, some investors and traders may use seasonal tendencies to build strategies, or may use the stock market seasonal patterns to enhance their existing strategies.
For example, if we know June tends to be a poor month for stocks, a trader who primarily takes long position may opt to take this month off, or exit their positions quicker than usually if they start to decline during the month of June. A trader could buy stock index ETFs (such as SPY or VOO) during seasonally strong months if it starts rising. An investor may buy-in and then sell-out at certain times of the year (if feasible to do so with commissions). Buy-and-hold investors may wish to invest during seasonally weak months to take advantage of lower prices.
Seasonality can be used in many ways. Individual stocks, commodities, and currencies also tend to have seasonal tendencies.
So let’s jump into the seasonal patterns of the stock market.
Stock Market Season Patterns
This is how the stock market has performed in each of the months over the last 10 and 20 years.
The number on top of the column is the percentage of time the stock index has risen. If it says 70, that means the stock index went up in that month 14 years out of 20 (70%).
The number at the bottom of the column is the average gain or loss in that month over the 10 or 20 years.
To give you a better idea of the best and worst months of the year, we will look at three major stock indices, the NYSE Composite, the S&P 500, and Nasdaq 100.
The NYSE Composite is all the stocks listed on the New York Stock Exchange so it’s a very diverse stock index. The S&P 500 includes only the largest companies in the US, and the Nasdaq 100 includes large companies that are primarily technology-based.
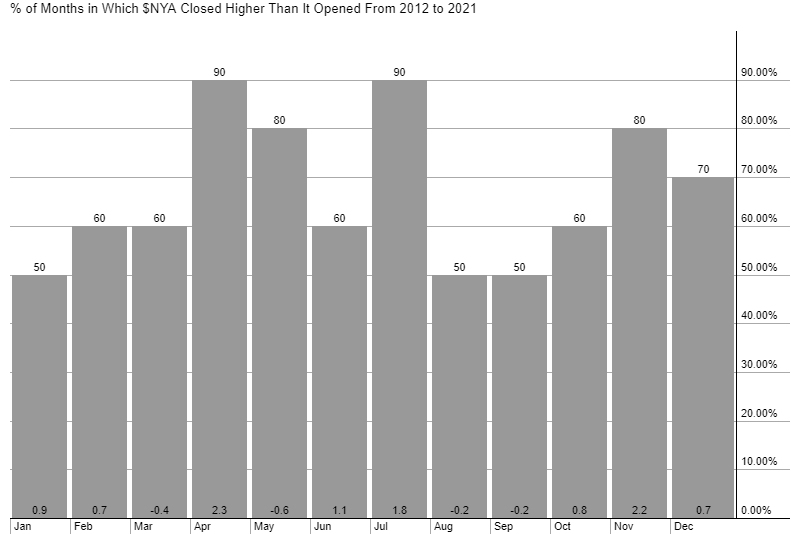
NYSE Composite Seasonal Patterns
The chart, courtesy of StockCharts.com, shows that the NYSE Composite tends to fall more often than it rises in January and June. But only marginally. It’s pretty close to 50/50. August and September also tend to have negative returns and rise only marginally more often than they fall.
April is one of the best months of the year for tending to rise and in terms of the overall gain.
April, May, July, November, and December all have shown a strong tendency of the price to rally in those months.

The above chart looks at 20 years of data. If we only look at the last 10 years, things change a little bit.
Apri, May, July, November, and December are all still likely to move higher (although May performance is actually negative because of some bad years), but June isn’t quite so bad.
We can also that overall August and September is a pretty weak time of the year of the stock market, it is pretty much a coin flip whether it will go higher or not, and returns have been negative (average) over the last 10 and 20 years.
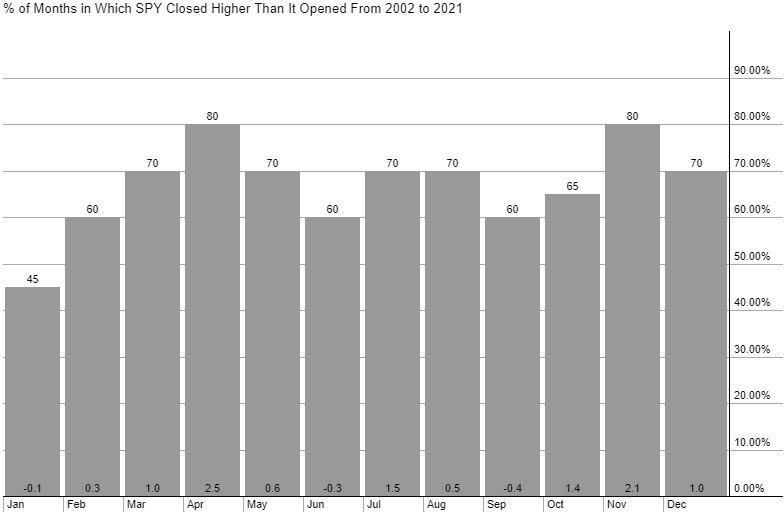
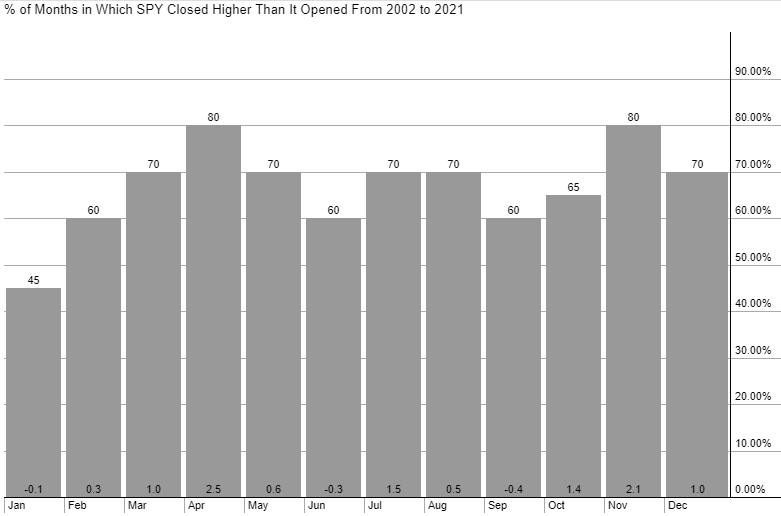
S&P 500 Seasonal Patterns
Here is how the S&P 500 index has done. The SPDR S&P 500 ETF (SPY) was used to generate the seasonality figures.
For this large cap. index, January, June, and September tend to be weak months in terms of moving higher and overall return.
March, April, May, July, August, November, and December are stronger months.
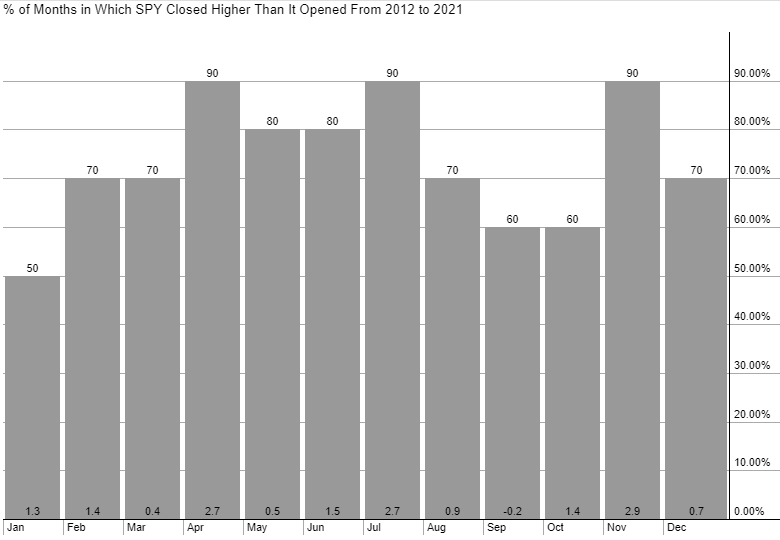
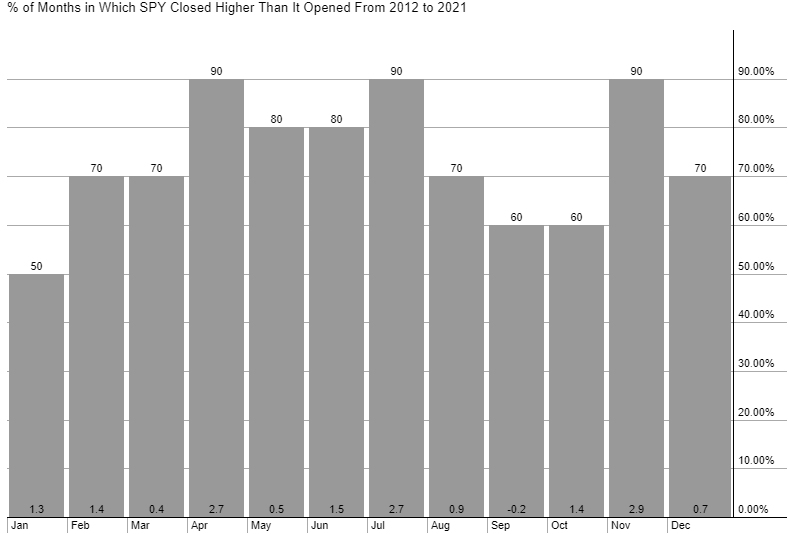
Over a 10-year period, not much changes except that the market is pretty much strong from February through to the end of August. September is a little weaker, and then the end of the year tends to be strong.
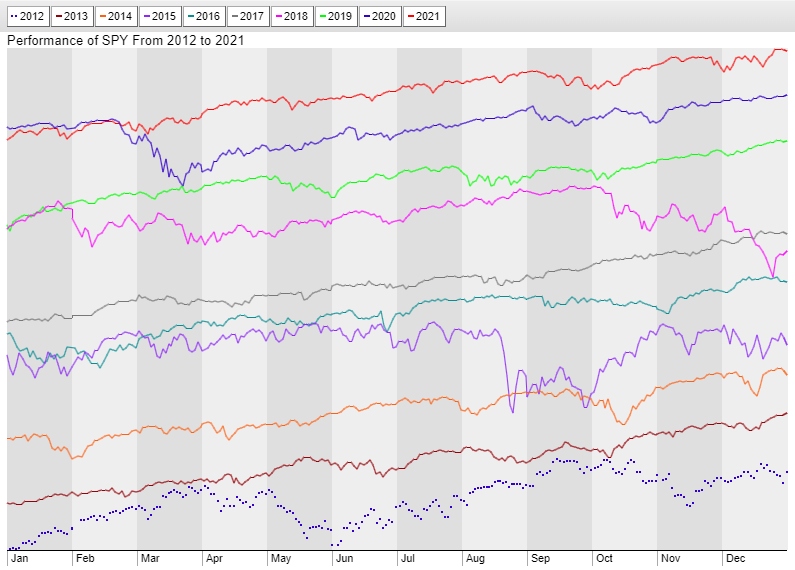
For a different look, and to see how some actual years have played out, here are the yearly charts of the S&P 500 (SPY) from 2012 to 2021. They are overlaid on top of each other for each viewing.
Nasdaq 100 Seasonal Patterns
Here is how the Nasdaq 100 index has done. The Investco QQQ Trust (QQQ) was used to generate the seasonality figures.
For this large cap. technology index, January, June, and September tend to be weaker months in terms of moving higher and overall return.
March, April, May, July, August, November, and December are stronger months. Same as the S&P 500.
Over a 10-year period, not much changes except that the market is pretty much strong from February through to the end of August. September is a little weaker, and then the end of the year tends to be strong. Once again, this is similar to the S&P 500.
Stock Market Seasonality Considerations
Think of seasonality as a tool, not a crystal ball. It shows historical tendencies, not what will happen this year.
If the market tends to rise 80% of the time in April, that means it went up in April 16 years of out the last 20, but it may not go up this year.
The average monthly return numbers can also be skewed by an extremely large fall or rise in a particular year. So a 1% average return could be the result of a couple of big drops of 10% in certain years and big rallies of 10% in others. The average is near zero, but investors should be aware that the average doesn’t tell the whole story.
Even during months that have a high probability of rising, stop losses and risk control should be used because if the price drops, we don’t know how far it will drop.
The US stock market has an overall upward bias over the long-term. On average it has produced 10.4% yearly returns over the last 100 years. Therefore, investors may consider using the weak months as entry points if looking to take long-term positions.
Additional Stock Market Seasonal Patterns
There are a number of specific seasonal patterns in stocks that people have noticed and tested. These tend to be shorter-term patterns.
Pre-Holiday Rally
It’s been noted that there’s a positive expectancy for buying stocks one to two days before a long weekend/holidays and then selling one to two days after. Trading volume tends to lower heading into long weekends which may help explain prices drifting up (there is a long-term upward bias to the stock market). Or possibly people are feeling good about a long weekend and buy some stock.
Short-term traders would buy one or two days prior to the holiday, and then sell one to two days after the holiday. Longer-term traders can also take advantage and use the one or two days prior to a holiday to pick up some stocks they were eyeing.
Actual testing reveals that most holidays don’t produce a big pop in stocks, but a few are more reliable and tend to produce positive returns over time according to QuantifiedStrategies:
- July 4th
- Thanksgiving
- Christmas (discussed more below)
At least according to history, these are better holidays than others for deploying the pre-holiday rally strategy.
Post-Holiday Rally
Buying on the close the day after the holiday and then selling on the next close has also shown a steadily rising equity curve (according to QuantifiedStrategies).
Santa Claus Rally
This one is highly documented and generally quite profitable, yielding an average of about 1.1% per trade in an index like the S&P 500. The strategy requires holding for the last 4 to 5 days of the year and then selling two to three days into the new year. The exact number of days can vary based on weekends and market closures. So utilize the closest number of days you can.
According to Quantified Strategies, buying on the third Friday of December (before options expiration) and selling on the close of the third trading day of January bumped the average return up to 1.79% per trade.
Intraday Patterns
There are also intraday repeating patterns that play out, which are useful for short-term traders and day traders.
Stock Market Seasonal Patterns Conclusion
Seasons patterns can be useful, but they can also be traps if we blindly follow them. Risk management must always be used to control losses, yet that may also mean getting out of some trades which would have otherwise been profitable if the favorable seasonal statistics play out.
Most of the season patterns are not statistically significant, meaning they are not based on enough data or haven’t accounted for other factors. They are essentially ideas with some evidence.
Before putting your capital to work based on seasonal patterns you may wish to do more thorough research.
More By This Author:
Stock Market Health Update For The Week Of Aug. 1
Stock Market Health Update For The Week Of July 25
Stock Market Health Update For The Week Of July 18


Comments
Log in or sign up to join the conversation.