

Image Source: Pixabay
Major US and Canadian stock indices are a little higher this week than the last, but overall not much has changed. We are still in an attempted rally within a longer-term downtrend. The turn higher has not been fully confirmed, yet more market health indicators are giving the thumbs up that a bottom could be in.
On the flip side, while I happened to pick one winning trade to be in a couple of weeks back, a lot of the stocks I have been watching haven’t acted very well. So that tells me conditions are still a little rough.
I’m still only deploying a portion of my capital until I see more trades working and potential/actual wins. Once an uptrend starts, there will be plenty of opportunities over the next year or two, so there’s no reason to get aggressive too early.
How the Market Indexes are Doing
I look at 4 different US indices because they each tell a different story about overall stock market health. The stock market is healthiest—and swing trading stocks on the long side is most profitable—when all these indexes are in uptrends. Here’s what each of the 4 indices represents:
- Nasdaq 100 – Tech stocks.
- S&P 500 – Large US companies.
- NYSE Composite – A wide array of stocks, varying in size and industry.
- Russell 2000 – Smaller companies.
2 Canadian stock indices are also included. The Composite tracks larger companies, while the Venture tracks very small companies. Those are regression channels on most of the charts – they create a channel of “the best fit” to the price action, helping to highlight the overall trend.

Charts are provided by TradingView – these are charts I personally use.
All the indices are in overall downtrends. The US indices have been trying to push higher over the last month. The Canadian indices are weaker, as oil and gold stocks have sunk recently. The follow-through days in the S&P 500 and Nasdaq 100 are the first signals to potentially start taking some long trades in strong stocks that are forming quality setups.
It is still very early in this uptrend, so I am not deploying all my capital. But seeing all the US indices pushing higher together is encouraging. We are not out of the woods yet, but we are hopefully getting there. The market health indicators are also improving.
State of the Market Health Indicators
The following chart shows the market health indicators I track. They tell me the condition of the stock market overall, and whether it’s a good time to swing trade individual stocks. The market health indicators are trying to improve.

- 55% of S&P 500 stocks are above their respective 50-day moving averages. 55% of all US stocks are above their respective 50-day moving averages. It’s generally much easier to swing trade profitably (on the long side) when more stocks are above their 50-day averages. When this indicator is below 50%, it tends to signal sideways movement or a downtrend for most stocks/indexes. This is a good indicator at minimum.
- Volume was relevant on June 24 when it increased with the 3% price rise to create a follow-through day.
- The dark blue bars are the daily percentage movement of the S&P 500. Big moves are associated with downtrends and turning points. Small values are associated with an uptrend. Values of -2 are a warning sign anytime they occur. We have seen no big drops in nearly a month. That is pretty good, but ideally the daily movements should stay within the bands, as that is more typical of uptrending behavior. This indicator is still volatile, but improving.
- The blue line is the cumulative NYSE Advance-Decline Line. I want this line to start making higher swing highs and lows. It is just starting to do that. That’s good to see. A little more upside, and this will get a thumbs up, too. Right now, it is a neutral to bullish indicator.
- The blue columns are NYSE up volume divided by NYSE total volume. It tracks buying and selling enthusiasm. There was a 91% upside day on July 19. That is bullish.
- The ultimate indicator is how many quality setups there are and how trades are working. I’ve been creating watchlists over the last couple of weeks, and a few trades have worked, but many haven’t. This tells me the market is still in rough condition.
I'm in one swing trade stock that's working. The rest I was watching are not acting great. Means I was lucky picking a winner; market conditions improving but still not great. I'll deploy more capital as more stocks start acting well.
— Cory Mitchell, CMT (@corymitc) July 24, 2022
Sectors on the Move
Over the last week and month, consumer cyclicals, technology, and industrials have been the top sectors. Healthcare has also been hanging in there, as it has been the top performer over the last three months and was ranked fourth in the last month. Top sectors are always changing, but they can provide ideas on where to look for trades.
Scan as usual, or run a scan with the added criteria of only looking for stocks within certain sectors to reduce the number of stocks on your list and reduce your scan time.
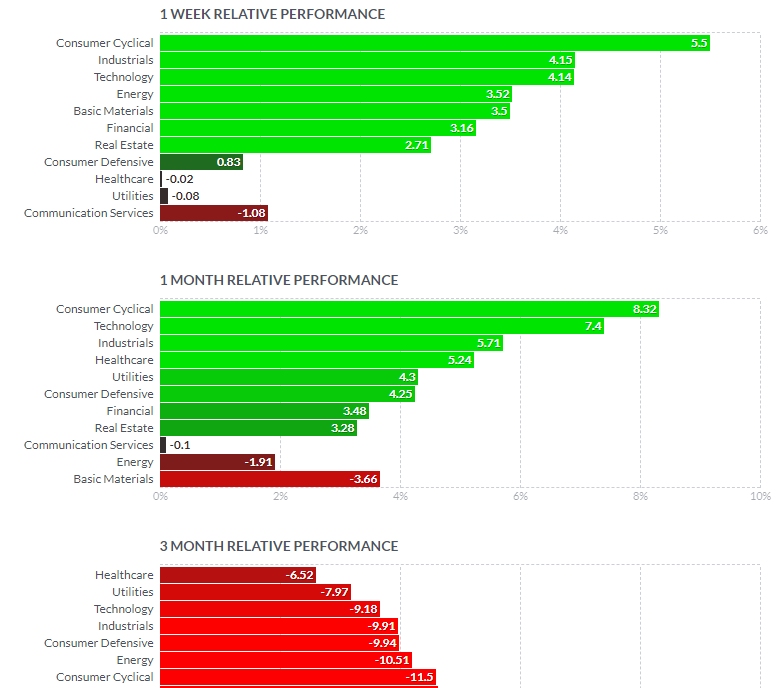
Sector performance provided by Finviz.
What I’m Doing Right Now
I will be scanning this weekend or early next week to find more setups I like the look of. The more there are, the better. That illustrates better market health.
I will also be monitoring the stocks on recent watchlists, because even though I may not be in those trades, those were stocks that were acting strongly up until recently, so I want to see how they act going forward. If they continue to act strong, that tells me things are working. If they don’t, it tells me to remain cautious.
I’m day trading, as always. There is a lot of movement and opportunity when day trading stocks, but I primarily day trade the EUR/USD currency pair every morning for one to two hours. There is a lot of opportunity to be found in that currency pair. Take the time to refine your strategies while swing trading is slow.
More By This Author:
Stock Market Health Update For The Week Of July 18
Swing Trading Stock Watchlist For The Week Of July 11 And Beyond
Stock Market Health Update For The Week Of July 11


Comments
Log in or sign up to join the conversation.