

Image Source: Unsplash
The stock market's health is currently in conflict. We saw some bearish signals from a couple of market health indicators, while a few others are holding up well. That means I will continue to take long trades, but with a reduced position size: 0.25 to 0.5 the normal size. I’m looking for trade setups based on contraction patterns and cup-and-handle patterns.
How the Market Indexes Are Doing
I look at 4 different US indices because they each tell a different story about overall stock market health. The stock market is healthiest—and swing trading stocks on the long side is most profitable—when all these indexes are in uptrends. Here’s what each of the 4 indices represents:
- Nasdaq 100 – Tech stocks.
- S&P 500 – Large US companies.
- NYSE Composite – A wide array of stocks, varying in size and industry.
- Russell 2000 – Smaller companies.
2 Canadian stock indices are also included. The Composite tracks larger companies, while the Venture tracks very small companies.
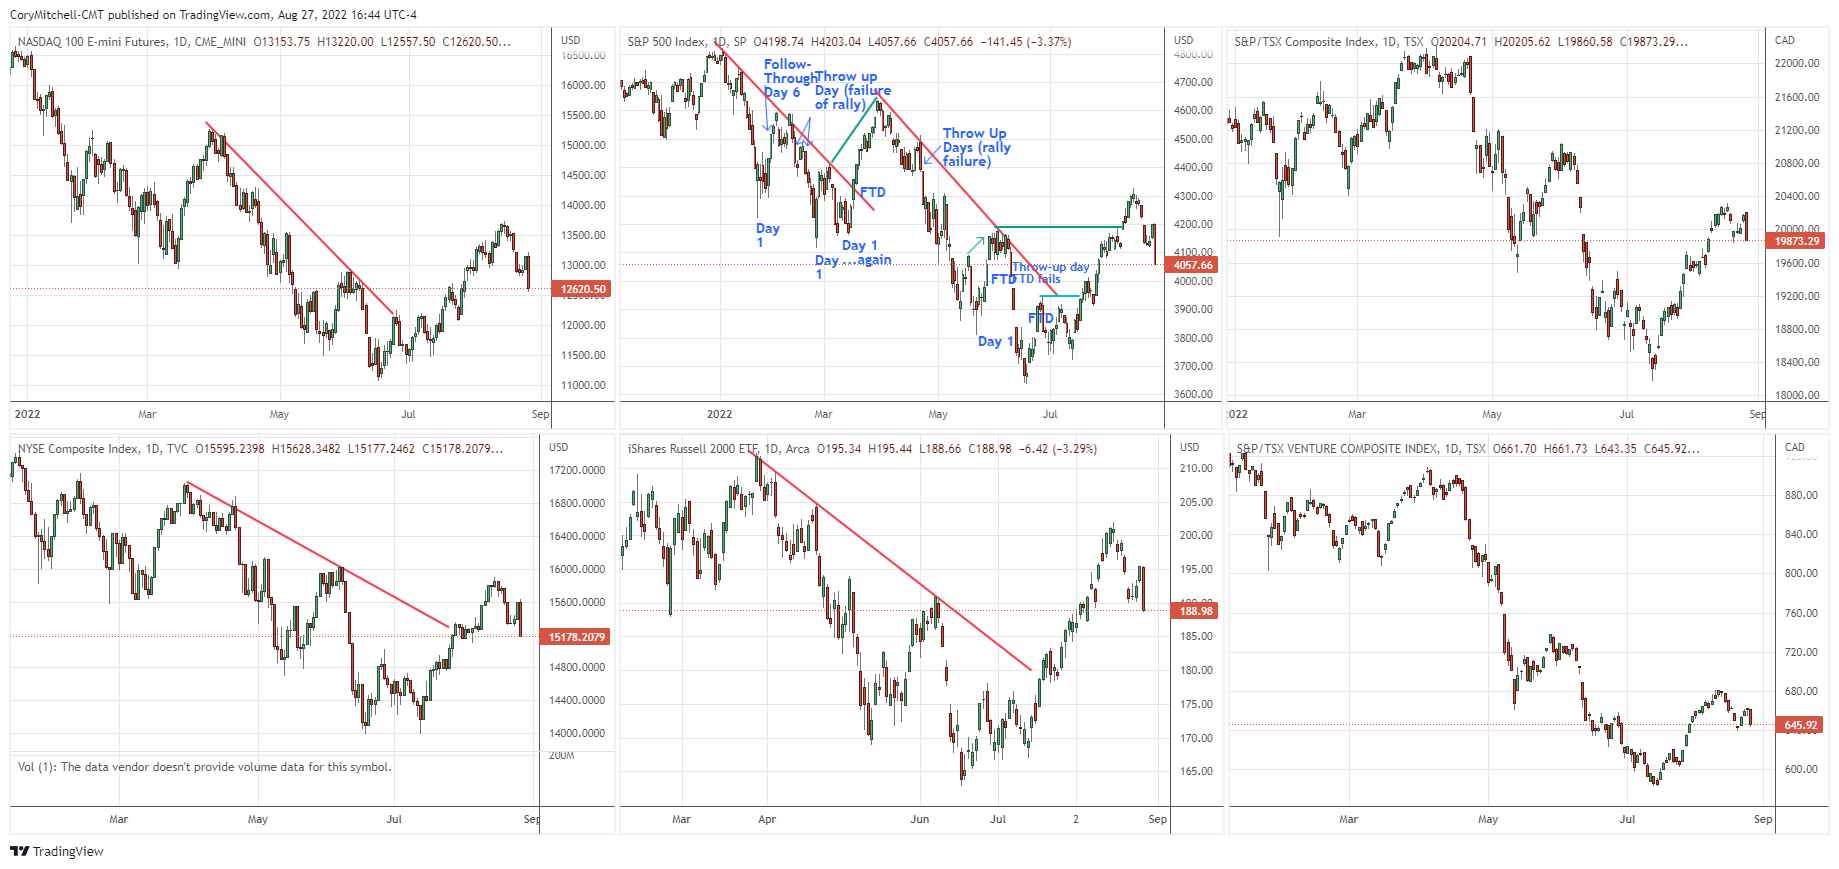
Charts are provided by TradingView – these are charts I personally use.
The indices are all experiencing pullbacks within a short-term uptrend. I never assume to know what will happen. This pullback could turn into a big decline, or the price could chop around or move higher again.
This is why I’m opting to hedge by bets. With the short-term uptrend, I want some long exposure. Because of the sharp recent downturn, I’m reducing my position size so that I don’t have as much capital deployed on the long side in the event of a further decline.
State of the Market Health Indicators
The following chart shows the market health indicators I track. They tell me the condition of the stock market overall, and whether it’s a good time to swing trade individual stocks.

The market health indicators are mixed, which is another reason why I’m cutting back on how much capital I deploy on my swing trades.
- 63% of S&P 500 stocks are above their respective 50-day moving averages. 60% of all US stocks are above their respective 50-day moving averages. It’s generally much easier to swing trade profitably (on the long side) when more stocks are above their 50-day averages. When this indicator is below 50%, it tends to signal sideways or a downtrend for most stocks/indexes. This is excellent.
- Volume was relevant on June 24 when it increased with the 3% price rise to create a follow-through day.
- The dark blue bars are the daily percentage movement of the S&P 500. Big moves are associated with downtrends and turning points. Small values are associated with an uptrend. Values of -2 are a warning sign anytime they occur. A more than 3% drop was seen on Aug. 26. This is bad.
- The blue line is the cumulative NYSE Advance-Decline Line. I want this line to start making higher swing highs and lows, and it has been doing just that. It has also moved above its early April high before the S&P 500 moved above its respective April high. That is a bullish divergence and signals that the S&P 500 is likely to reach the April high before a new low. The indicator also stayed above April 9 levels, while the S&P 500 fell below its April 9 level. This is an indicator in good condition.
- The blue columns are NYSE up volume divided by NYSE total volume. It tracks buying and selling enthusiasm. There were 91% upside days on July 19 and Aug. 10. That’s bullish. But there was a 90% downside day on Aug. 26 (manually calculated), which was bad.
- The ultimate indicator is how many quality setups there are and how trades are working. I have been scanning, but not a lot of stocks have been setting up and triggering trades. So I’m willing to trade, but haven’t been able to deploy much capital yet. That is likely to continue this week. I will be scanning, but I don’t expect to find much. This pullback needs to last a little longer in order for more stocks to form proper contraction patterns or handles.
Sectors on the Move
Almost everything took a hit last week, except for energy, which held up. It has been the top performer over the last month. Over the last three months, not much has changed from prior weeks. Consumer cyclicals, technology, and industrials have been the top groups.
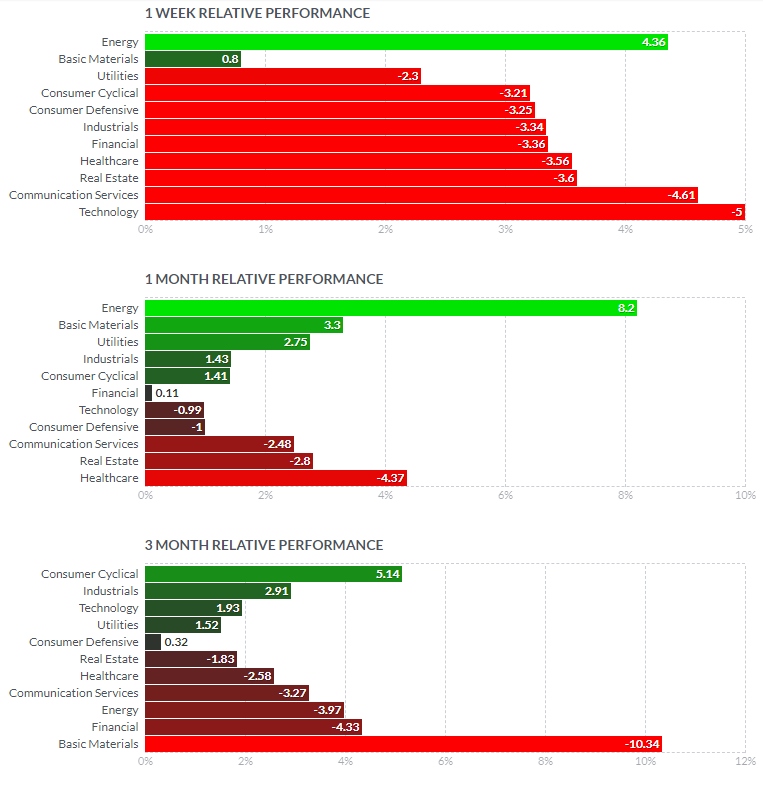
Sector performance provided by Finviz.
I would say to scan as usual, or run a scan with the added criteria of only looking for stocks within certain sectors to reduce the number of stocks on your list and reduce your scan time.
What I’m Doing Right Now
I’m scanning and taking stock swing trades when I get setups. But as mentioned, I am limiting capital deployment based on the recent drop. I view the drop as healthy, as it will create a lot more quality swing trades going forward.
I'm day trading, as always. Lots of movement and opportunity day trading stocks. I recently started working on a Day Trading Stocks Course, so I will get that out as quickly as possible, probably sometime in October.
More By This Author:
Seasonal Patterns Of The Stock MarketStock Market Health Update For The Week Of Aug. 1
Stock Market Health Update For The Week Of July 25


Comments
Log in or sign up to join the conversation.