

Image Source: Unsplash
SPX Monitoring purposes; Long SPX 4/12/24 at 5123.41.
Our Gain 1/1/23 to 12/31/23 SPX= 28.12%; SPX gain 23.38%
Monitoring purposes GOLD: Long GDX on 10/9/20 at 40.78.
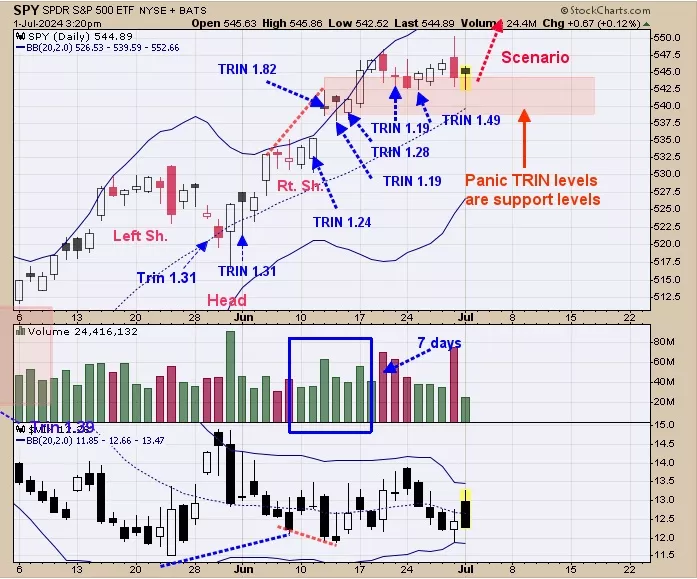
We updated this chart from last week. We listed in blue on the chart above the TRIN closes of 1.19 and higher (TRIN >1.20 shows panic and panic only forms near lows). We shaded in light pink where the panic TRIN levels occurred and in turn, suggests support for the SPY which comes in between 540 to 545. There is usually a summer rally that starts around the July 4 time frame and lasts into mid to late July, so seasonality-wise the market enters into a bullish period. SPY has been sideways for 9 days (tight trading range) and suggests stored-up energy that suggests a strong move is coming. Staying long the SPX.
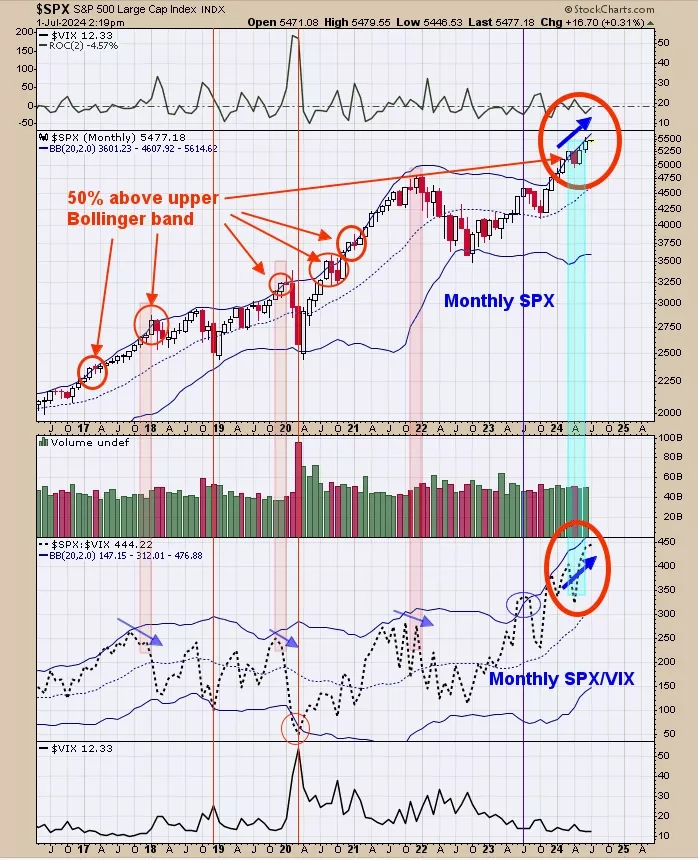
The second window up from the bottom is the monthly SPX/VIX ratio and the next higher window is the monthly SPX. Intermediate highs can form when the monthly SPX makes higher highs and the monthly SPX/VIX ratio makes lower highs. This chart goes back to mid-2016. We pointed out the times when the monthly SPX made higher highs and the monthly SPX/VIX ratio made lower highs (noted shaded pink). Currently, we have the SPX making higher highs and the SPX/VIX ratio making higher highs giving the “all clear” for now. Staying long the SPX for now.
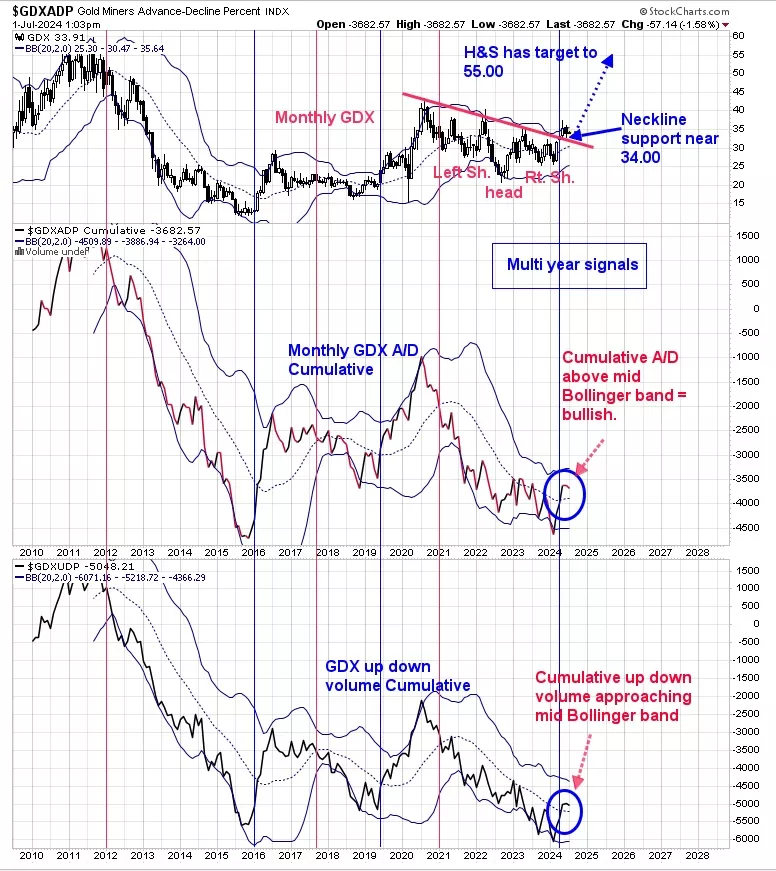
The above chart is the chart that gave a buy signal on a monthly close of May that in the past triggered buy signals that lasted a year and longer. A monthly buy signal is triggered when the monthly GDX Up down volume closes above its mid Bollinger band (bottom window) and the monthly GDX advance/decline closes above its mid Bollinger band (next window higher). The blue lines on the chart show the times when both indicators closed above their mid-Bollinger bands and the red lines show when both indicators close below their mid-Bollinger bands. On May 31 both indicators closed above their mid-Bollinger bands suggesting a multi-year buy signal for GDX was triggered.
More By This Author:
Bigger Picture Remains Bullish
Bigger Trend Remains Bullish
Short Term Divergence


Comments
Log in or sign up to join the conversation.