
SPX Monitoring purposes; Long SPX 4/12/24 at 5123.41.
Our Gain 1/1/23 to 12/31/23 SPX= 28.12%; SPX gain 23.38%
Monitoring purposes GOLD: Long GDX on 10/9/20 at 40.78.
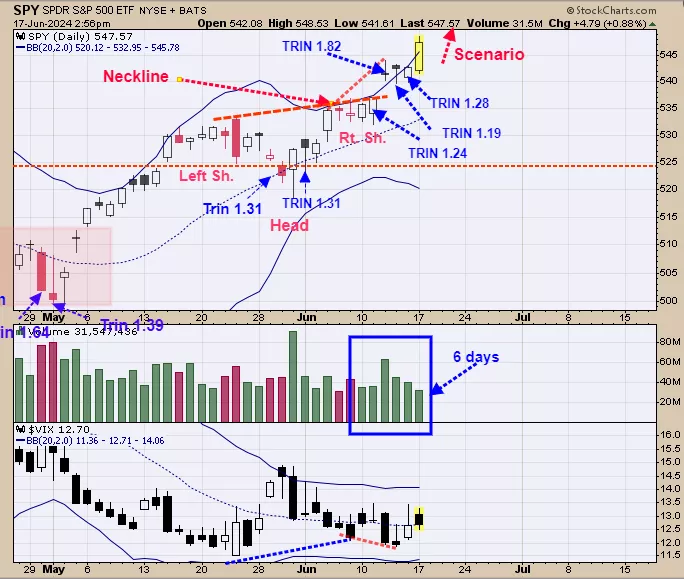
Last Wednesday’s jump above the Neckline of a Head and Shoulders bottom on higher volume implies a valid breakout. The Head and Shoulders pattern is noted on the chart above in red lettering. Support now lies near 537 SPY (Neckline) and there is an open gap between 537 to 540 that may (or may not) get filled. We noted in blue the TRIN closes of near 1.20 and higher which shows where panic lies and a bullish sign, Notice also that today marks the sixth day up in a row and that predicts the market will be higher within 5 days 91% of the time. The bigger trend remains bullish. This potential Head and Shoulder bottom has a measured target near 555 which is about 1.5% higher. Staying long the SPX.
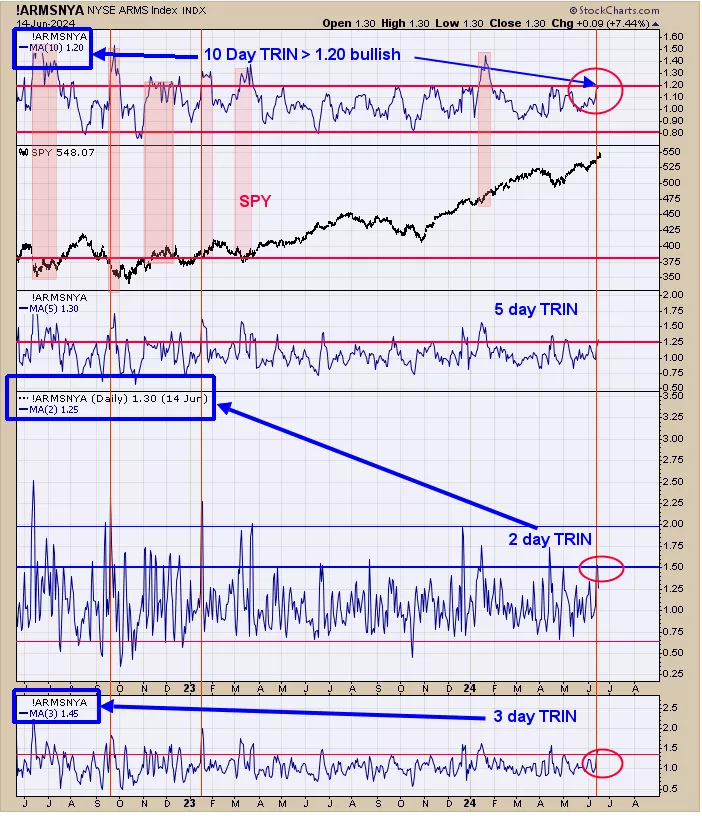
Panic only forms at bottoms in the market, no panic, no bottom. We use TRIN closes to help define where panic lies in the market. TRIN closes above 1.20 is considered a panic reading. A two day TRIN of 1.50 shows panic for the short term which was reached on June 12. A three day TRIN of 1.40 and higher adds to the bullish short term picture. A 10 day TRIN of 1.20 (two weeks of panic) and higher shows there is panic in the market to start the next rally higher. The 2 , 3, and 10 day TRIN averages hit panic levels in the last few days suggesting a rally may be starting.
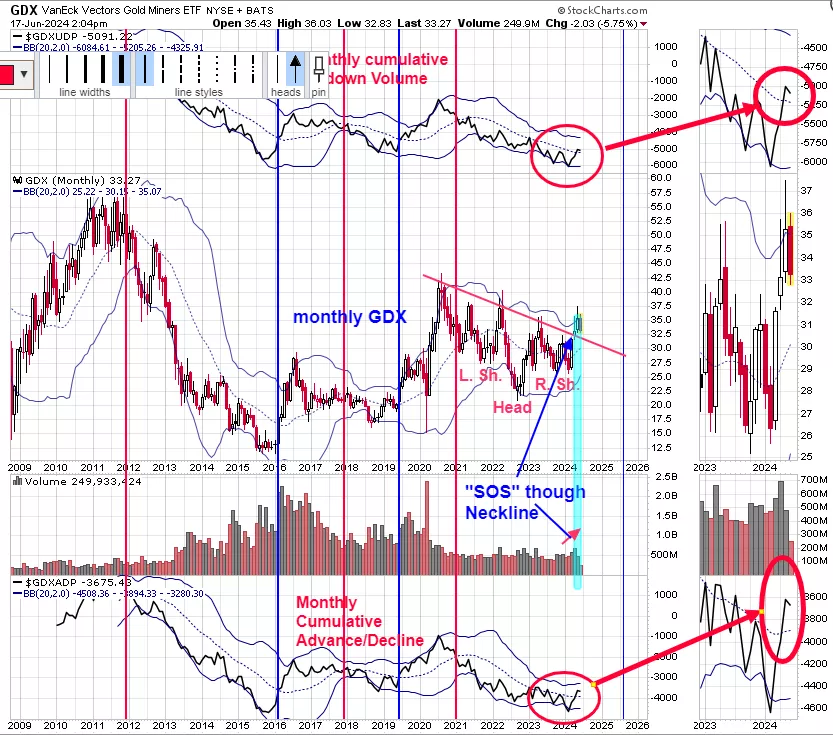
The bottom window is the monthly GDX cumulative Advance/Decline and top window is the monthly GDX cumulative up down volume and middle window is the GDX. We circled in red on both the upper and lower windows noting that both indicators closed above their mid monthly Bollinger bands triggering a multi month if not a multi year bullish signals. Signals of this type have lasted at a minimum of 1 ½ years to four years. We noted in shaded green where GDX jumped the Neckline of a Head and Shoulder bottom with a “Sign of Strength” (SOS) which in turn confirms the Head and Shoulders bottom. Support now comes in at the Neckline which is near current levels.
More By This Author:
Short Term Divergence
Uptrend Remains On Track
Bigger Trend Remains


Comments
Log in or sign up to join the conversation.