
SPX Monitoring purposes; Long SPX 4/12/24 at 5123.41.
Our Gain 1/1/23 to 12/31/23 SPX= 28.12%; SPX gain 23.38%
Monitoring purposes GOLD: Long GDX on 10/9/20 at 40.78.
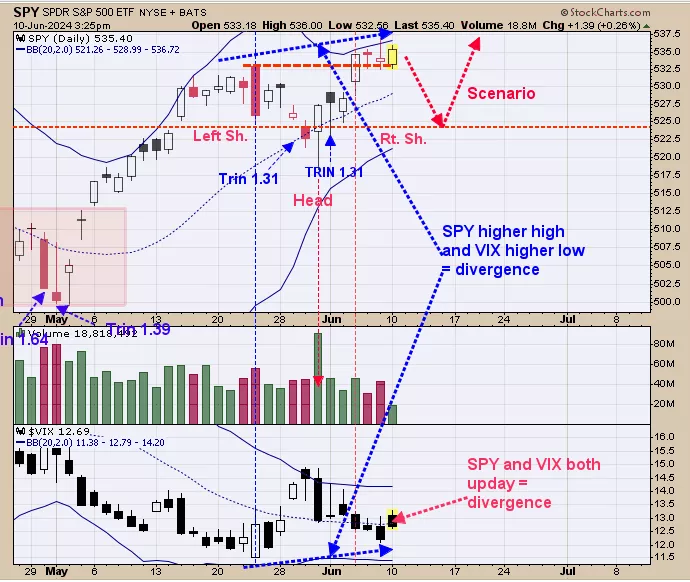
Short-term divergence on present. Since May 23 the SPY has made a higher high and the VIX has made a higher low which equals a divergence. Today the SPY traded higher and the VIX traded higher and another divergence. Our view short term because of the divergences is pull back to support near 525 SPY. The potential pull back could form the Right Shoulder of a Head and Shoulder bottom; page two shows that setup. The bigger trend remains bullish.
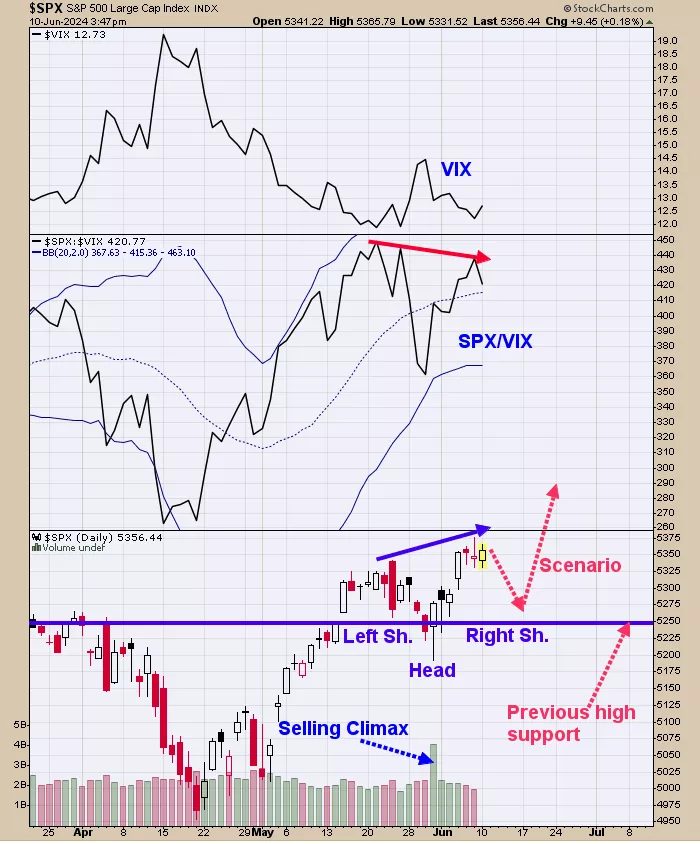
May 31 marked a “Selling Climax” and marked the low in the SPX and what we are defining is the Head of a Head and Shoulders bottom. From the May 31 low the SPX rallied to a new short-term high; the SPX/VIX ratio (next higher window) made a lower high and a negative divergence. This divergence could produce the next potential pullback from the “Right Shoulder” and complete a “Head and Shoulders Bottom”. The potential pull back should find support near the previous high of Late March near 5250 SPX. Seasonality wise there is a Summer rally that starts around July 4 and runs into month end. The “Right Shoulder” could start forming around now and run into late June or early July. Join us at @OrdOracle.
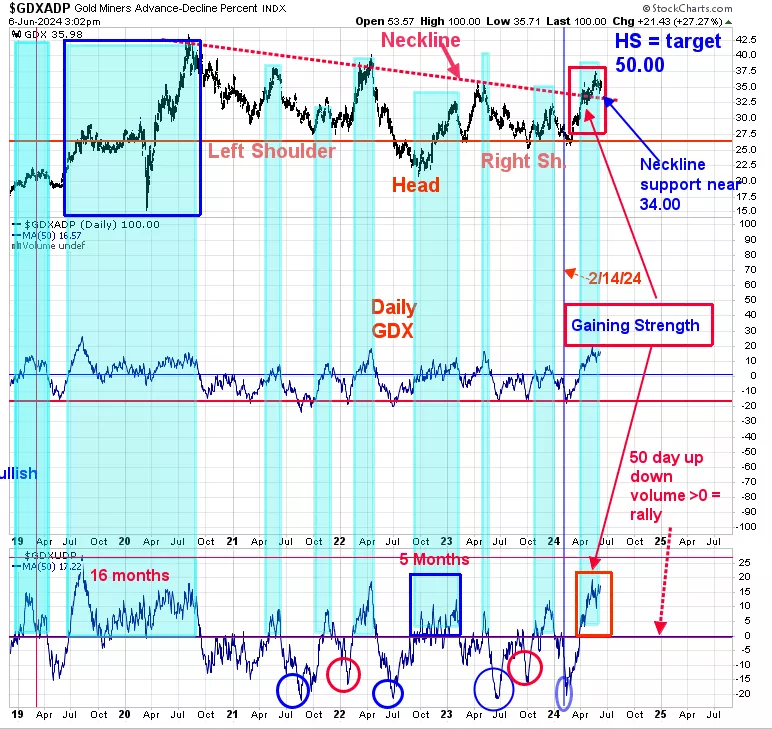
The bottom window is the 50 day average of the up down volume for GDX. GDX is considered in a rally mode when this indicator is above “0” and in a declining mode when below. This indicator has been above “0” since first of April and remains relatively strong holding near the +15 range (current reading is +17.22). In bull runs this indicator can stay above “0” for months. The light shaded green on the chart above shows the times then this indicator was above “0”. Top window is the GDX. It appears a Head and Shoulder pattern developed going back to mid 2020. The Neckline was broken around the 34.00 range (noted with red dotted line) and this area should act as support which is where GDX is now. Depending has the Neckline is drawn; the Neckline range could be from 33.00 to 34.00. This Head and Shoulder’s pattern has a measured target near 55.00.
More By This Author:
Uptrend Remains On Track
Bigger Trend Remains
The Week Before Memorial Day


Comments
Log in or sign up to join the conversation.