
SPX Monitoring purposes; Long SPX 4/12/24 at 5123.41.
Our Gain 1/1/23 to 12/31/23 SPX= 28.12%; SPX gain 23.38%
Monitoring purposes GOLD: Long GDX on 10/9/20 at 40.78.
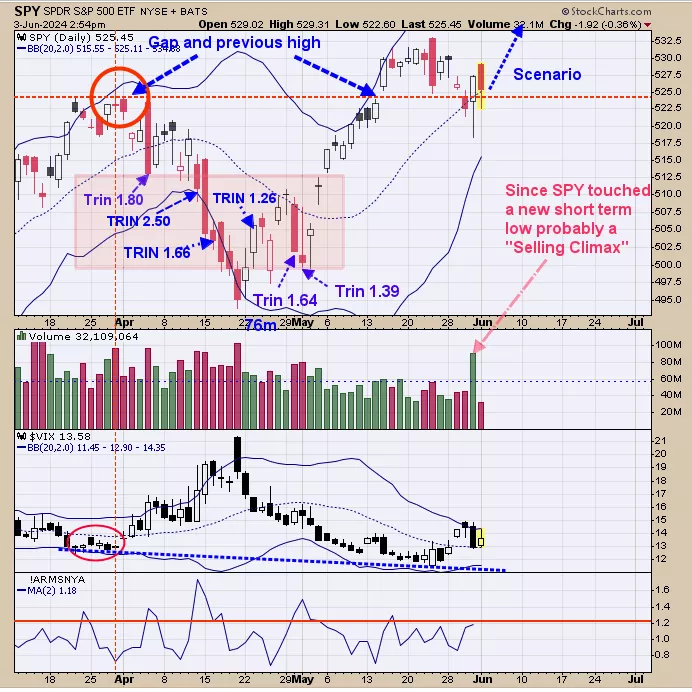
Friday was a bit unusual day as SPY was down going into the close and right before the final bell the SPY rallies strongly and end positive for the day. Volume also spiked suggesting a Climax. We are taking this volume spike as a “Selling Climax” as the SPY was reaching a new short term low when the volume spike happened. Second window up from the bottom is the VIX: which remains relative low and bullish. Uptrend remains on track. Staying long SPX.
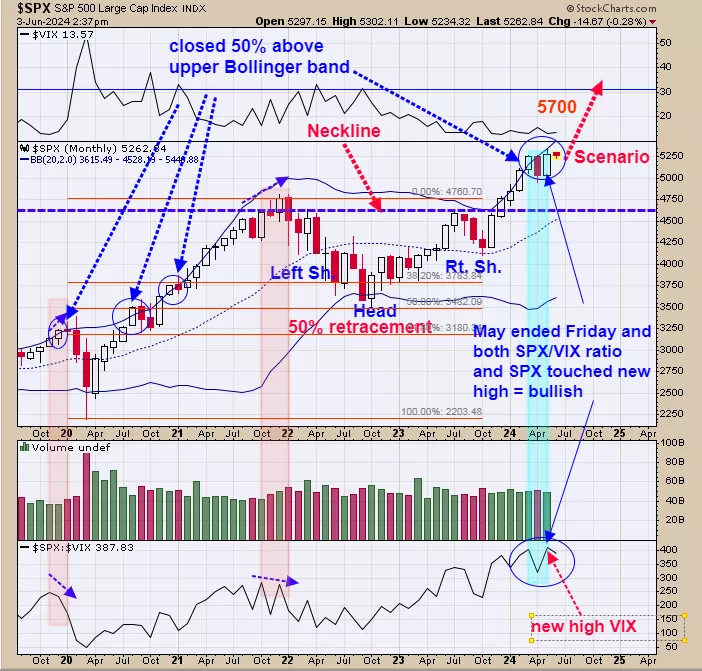
May ended Friday and both SPX and SPX/VIX ratios traded higher and kept the bullish divergence. A negative divergence would appear if the SPX made a higher highs and the SPX/VIX ratio made a lower high (noted with shaded light pink). Negative divergences have led to declining markets. Intermediate term trend remains bullish.
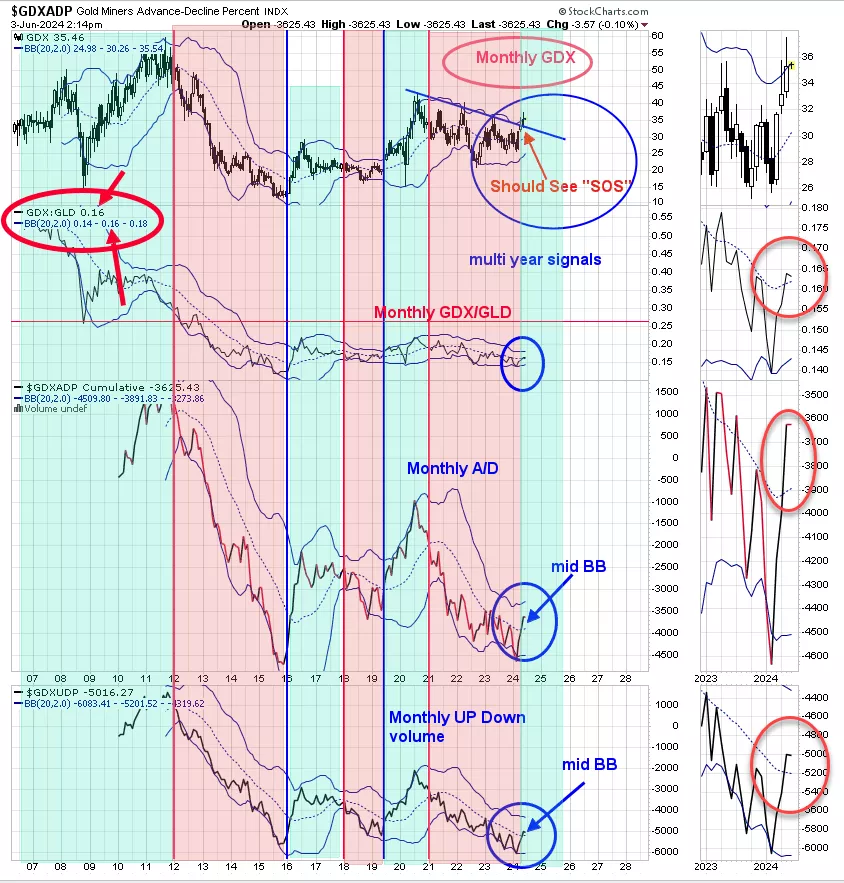
Last Thursday we said, “Tomorrow is month end for May. The chart above is updated to today’s trading. If all three indicators hold above their mid Bollinger bands into Friday’s close a bullish multi month if not a multi year signal will be triggered. Yesterday we said, “Above is the monthly GDX (top window) next lower window is the monthly GDX/GLD ratio; below that is the monthly Advance/Decline for GDX and bottom window is the monthly Up down volume for GDX. We shaded in light green the times when Up down volume and Advance/Decline are above the mid Bollinger bands and shaded in light pink when below. The month of May ends this Friday. To the far right is zoom thumbnail to see better of what is going on. A bullish longer signal for GDX will occur when all three indicator close above their mid Bollinger bands; and as you can see all three are above their mid Bollinger bands. Since this is a monthly chart, all three need to hold above their mid Bollinger band going into Friday’s close (end of month of May). Previous signals of this type have lasted 1 ½ years to 4 years.”. Chart updated to today’s trading. All their indicators closed above their mid Bollinger bands last Friday signaling a multi month if not a multi year buy signal for gold stocks.
More By This Author:
Bigger Trend Remains
The Week Before Memorial Day
A New Uptrend Has Started


Comments
Log in or sign up to join the conversation.