
Buffeted by SVB, income and spending, and PCE releases.
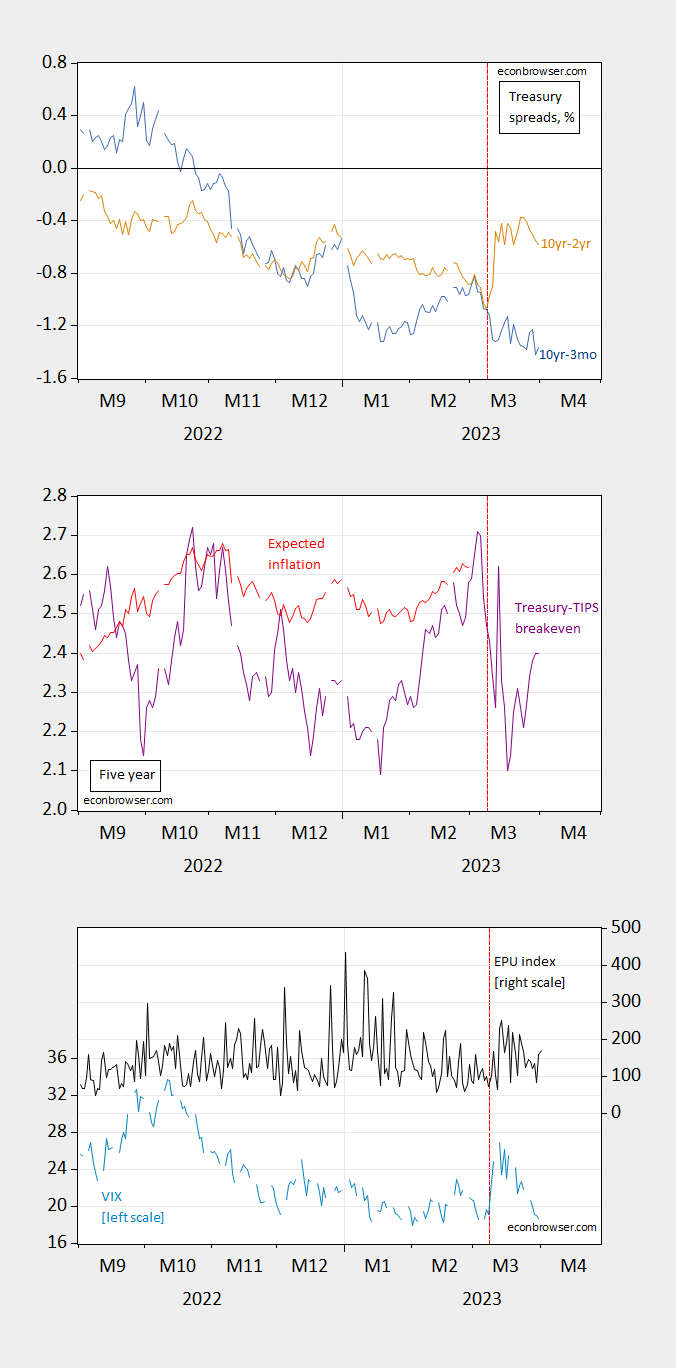
Figure 1: Top panel: 10yr-3mo Treasury spread (blue), 10yr-2yr spread (tan), both in %; Middle panel: 5 year Treasury-TIPS spread (purple), 5 year spread adjusted for liquidity and risk premia (red); Bottom panel: VIX (sky blue, left scale), EPU (black, right scale). Source: Treasury via FRED, KWW following D’amico, Kim and Wei (DKW), CBOE via FRED, policyuncertainty.com.
The 10yr-2yr has risen, while the 10yr-3mo remains deeply mired in negative territory. Here’s what the yield curve looks like as of Friday relative to pre-SVB, and relative to pre-Ukraine.
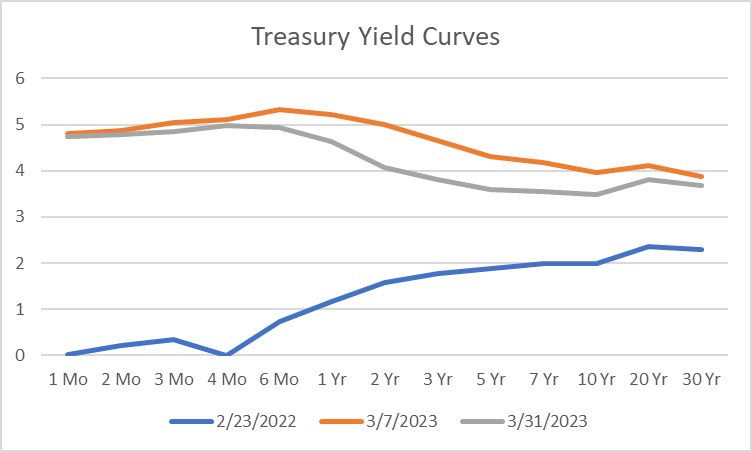
Source: Treasury.
Pre-Ukraine, the yield curve was signaling continued growth. Even before SVB’s collapse, the yield curve had inverted along a broad portion of the spectrum, and post-SVB it has even more at the 2 yr-6 mos portion.
The 5 year Treasury-TIPS spread has come down, although with premia also likely changing, it’s hard to say what this means. Risk as measured by the VIX has come down too, while uncertainty as measured by the Baker, Bloom & Davis “news”-based measure remains elevated.
I do think it interesting that the 5 year TIPS has come down. In fact, essentially the entire nominal rate decrease is accounted for by the real rate decrease, suggesting decreased economic activity.
The jump in oil prices in response to reduced OPEC+ pledged output is likely to alter rates.
More By This Author:
Oil Prices, Fed Funds Path Up
A Statistical Analysis Of Implications Of Using The “China Virus” Phrase
PCE Inflation For February


Comments
Log in or sign up to join the conversation.