Oil Prices, Fed Funds Path Up

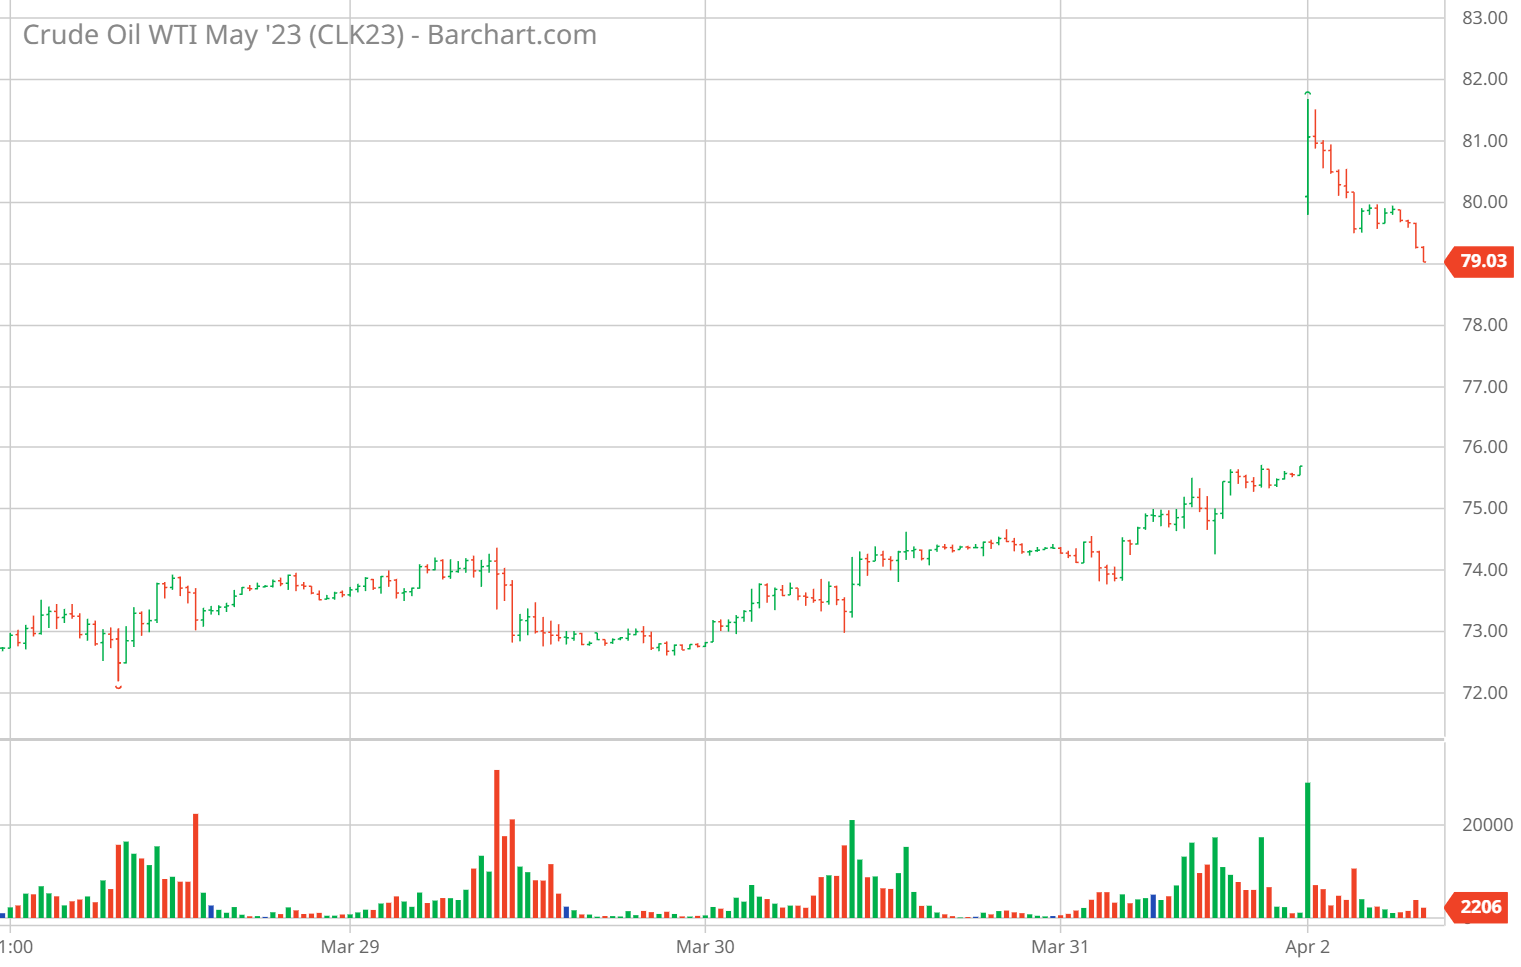
Source: BarChart.com.
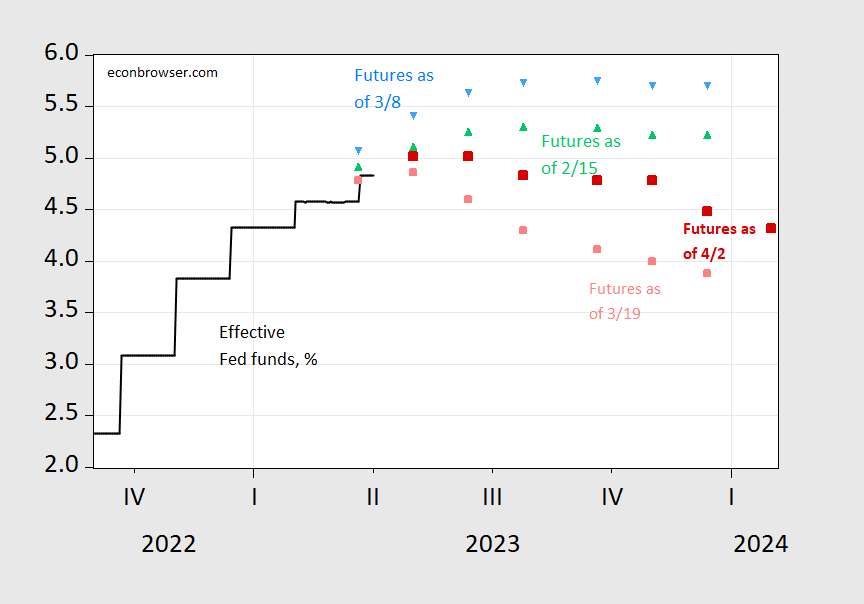
Figure 1: Effective Fed funds (black), implied Fed funds as of April 2 9:30PM CT (red square), March 19, 4:30 CT (pink square), March 8 (sky blue inverted triangle), and February 15 (green triangle). Source: Fed via FRED, CME Fedwatch and author’s calculations.
More By This Author:
A Statistical Analysis Of Implications Of Using The “China Virus” PhrasePCE Inflation For February
Business Cycle Sit-Rep, End-March
Comments
Please wait...
Comment posted successfully
No Thumbs up yet!


