Productivity And Costs In Q1
Productivity growth underperforms (-2.7% vs. -1.8% Bloomberg consensus, q/q AR), while unit labor costs surprises on the upside (+6.3% vs. +5.5% consensus, 3.3% previous).
Hours rose as output fell. Seemingly pretty bad news, but I think it’s useful to put these recent growth rates in context by looking at the levels.

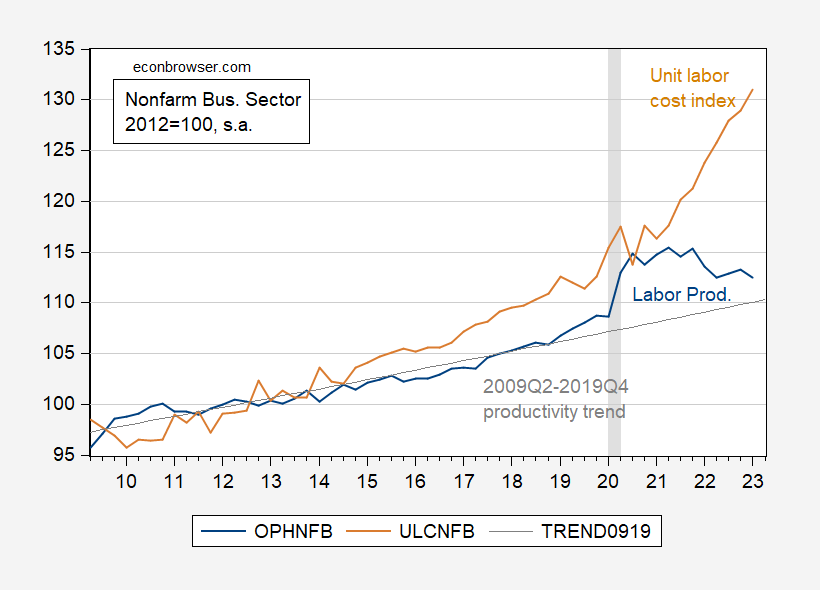
Figure 1: Nonfarm business sector output per hour index (blue), 2009Q2-2019Q4 deterministic trend (gray line), and unit labor costs index (tan), all 2012=100, all on log scale. NBER defined peak-to-trough recession dates shaded gray. Source: BLS, NBER, and author’s calculations.
One should view the lackluster productivity growth against the backdrop of an immense surge in measured productivity associated with the labor shedding during the pandemic, and the shortfall in employment relative to pre-pandemic trends. The current level is above the pre-pandemic trend (not that that is where productivity should be – that depends on lots of other factors). Right now, we are adjusting out of labor dis-hoarding into labor hoarding, explaining the decline in measured labor productivity.
(Note that these estimates will be revised over time; 80% of changes from advance to 3rd release to q/q AR productivity range from -1.0% to +1.4%.)
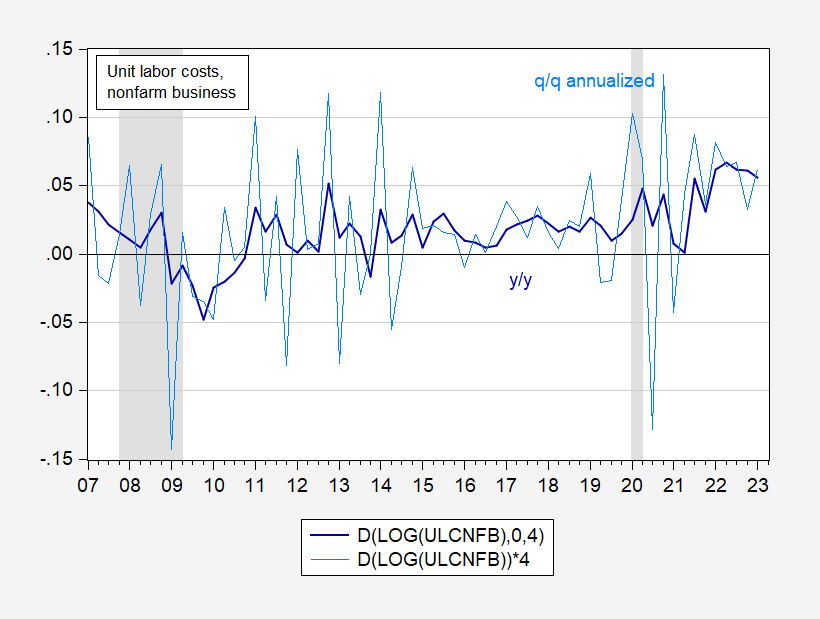
On the other hand, unit labor costs — the ratio of compensation to real output per hour — continued to rise. One way of thinking about this variable is that it represents a form of cost-push shock. Hence, a quickly rising unit labor cost (ULC) index confronts the Fed with a tougher challenge, as compared to a decelerating growth of ULCs.

Figure 2: Growth rate of year-on-year unit labor costs (ULC) (dark blue), and quarter-on-quarter annualized (light blue), both calculated using log differences. NBER defined peak-to-trough recession dates shaded gray. Source: BLS, NBER and author’s calculations.
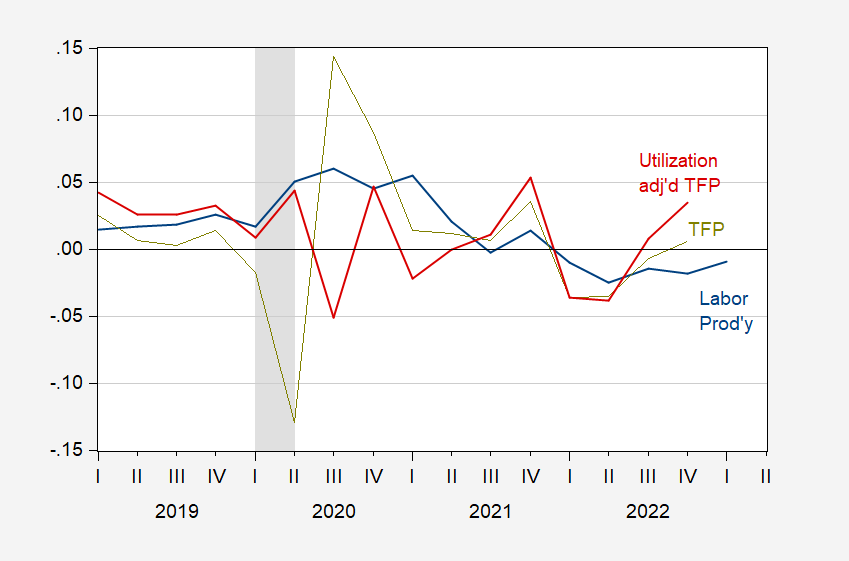
Final note: We rely on labor productivity because we believe we estimate it with greater accuracy than total factor productivity. In fact, total factor productivity (TFP) calculations are also affected by changes in capacity utilization (so capital “hoarding” as well as labor hoarding). Below I present y/y growth in labor productivity (from Figure 1) as compared against y/y growth in TFP and utilization-adjusted TFP, as estimated by John Fernald.

Figure 3: Year-on-year growth rate of output per hour (blue), of total factor productivity (chartreuse), and utilization adjusted total factor productivity (red), all calculated using log differences. NBER defined peak-to-trough recession dates shaded gray. Source: BLS via FRED, Fernald/SF Fed, NBER, and author’s calculations.
More By This Author:
Thirty-Year Mortgage Treasury Spread
ADP Private NFP Growth Upside Surprise
Market On Debt Default Risk


