

Image Source: Pixabay
Inflation has not kept with wage growth over the last year.
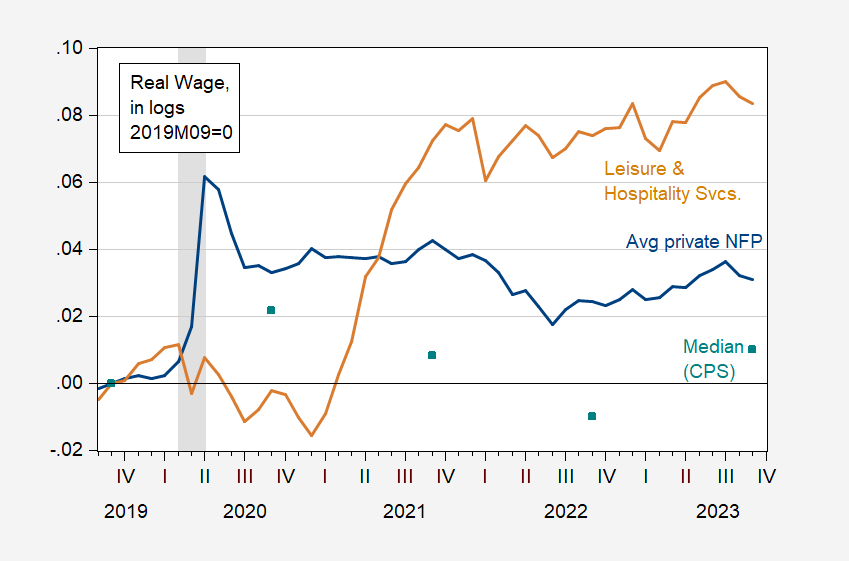
Figure 1: Cumulative growth of average hourly earnings from CES adjusted by Chained CPI (bold black), leisure and hospitality services (tan), median average hourly earnings calculated from CPS data (teal squares), relative to 2019M09. CES hourly wages for production and non-supervisory workers. NBER defined peak-to-trough recession dates shaded gray. Source: BLS, Atlanta Fed, NBER and author’s calculations.
More By This Author:
Inflation: Known Unknowns
Business Cycle Indicators, Mid-October
“The Inflation Surge Is Over. Now We’ll See If Interest Rate Increases Cause Recession.”


Comments
Log in or sign up to join the conversation.