
Industrial and manufacturing production surprise on the upside (0.3% m/m vs. 0.1% consensus, 0.4% vs. 0.1% respectively), with August growth revised up. Here is a picture of key indicators followed by the NBER BCDC as well as monthly GDP (SPGMI) and GDPNow (at 5.4% q/q SAAR as of today).
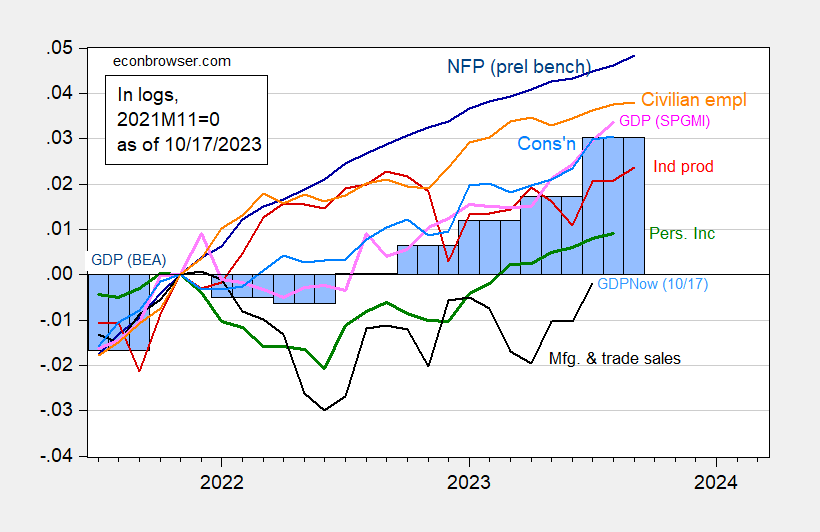
Figure 1: Nonfarm Payroll employment incorporating preliminary benchmark (dark blue), civilian employment (orange), industrial production (red), personal income excluding transfers in Ch.2017$ (green), manufacturing and trade sales in Ch.2017$ (black), consumption in Ch.2017$ (light blue), and monthly GDP in Ch.2017$ (pink), GDP (blue bars), all log normalized to 2021M11=0. Source: BLS via FRED, BLS preliminary benchmark, Federal Reserve, BEA 2023Q2 third release incorporating comprehensive revisions, S&P Global/IHS Markit (nee Macroeconomic Advisers, IHS Markit) (10/2/2023 release), Atlanta Fed (10/17/2023 release), and author’s calculations.
Hard to see the recession as being here in September (not speaking of October onward). Though the usual caveat applies – all series will be revised, and GDP very much.
Here are more nowcasts as of today.
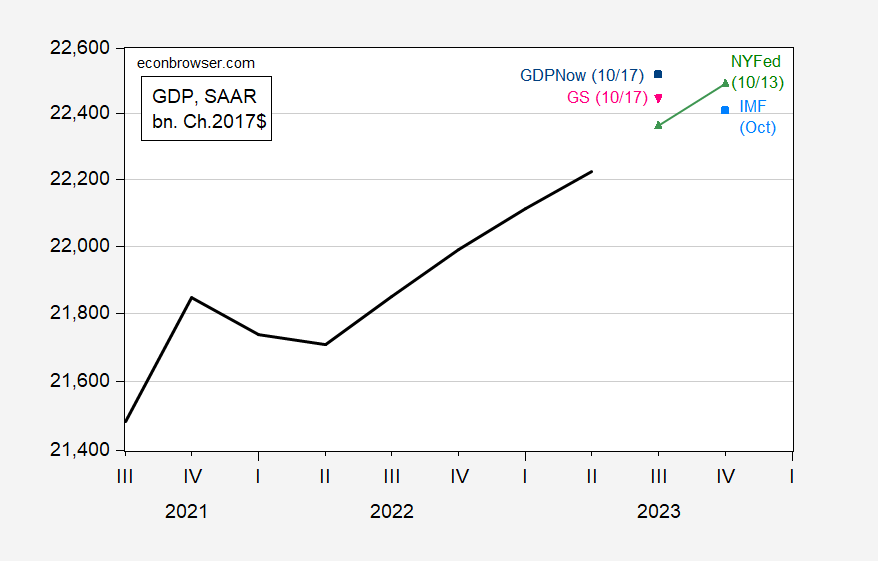
Figure 1: GDP as reported (bold black), GDPNow of 10/17 (blue square), NY Fed nowcast of 10/13 (green triangles), Goldman Sachs tracking as of 10/17 (pink inverted triangle), IMF October WEO (sky blue square), all in billions Ch.2017$, SAAR. Source: BEA comprehensive revision, Atlanta Fed, NY Fed, Goldman Sachs, IMF WEO, and author’s calculations.
No slowdown in Q3 according to these nowcasts.
More By This Author:
“The Inflation Surge Is Over. Now We’ll See If Interest Rate Increases Cause Recession.”
Inversions, Bear Steepening Dis-Inversions, And Recessions
CPI Inflation In September: Instantaneous Headline, Core & Headline Median And Trimmed Mean


Comments
Log in or sign up to join the conversation.