Inflation In July
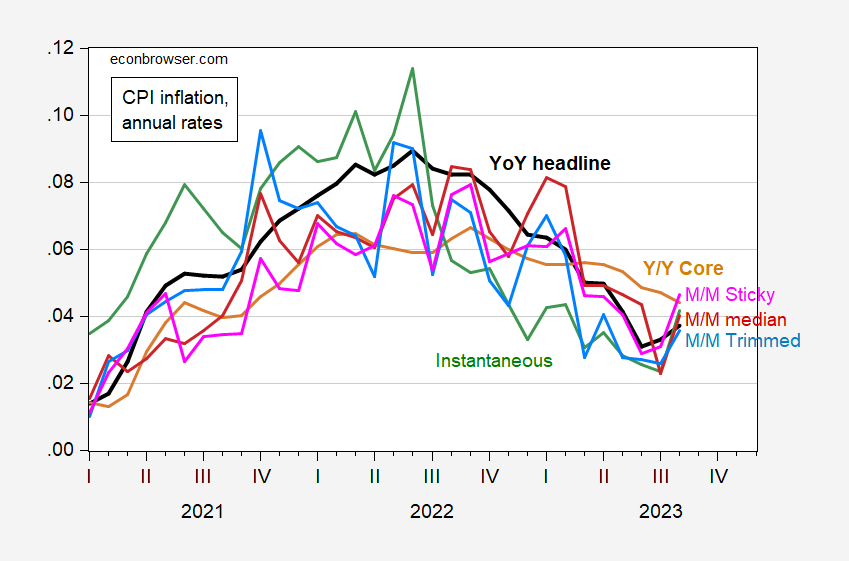
Month-on-month CPI headline (core) at (0.1 ppt above) Bloomberg consensus. Month-on-month PPI 0.3 ppts above consensus of 0.4 ppts. Y/Y core CPI continues to decline, while instantaneous core inflation is flat.

Figure 1: CPI headline y/y inflation (bold black), core y/y inflation (tan), m/m sticky price (pink), m/m median (red), m/m 16% trimmed (sky blue), and instantaneous (per Eeckhout, T=12, a=4) (green) all at annual rates. Source: BLS, Cleveland Fed, Atlanta Fed via FRED, and author’s calculations.
All the month-on-month series showed an uptick, even ones excluding energy prices.
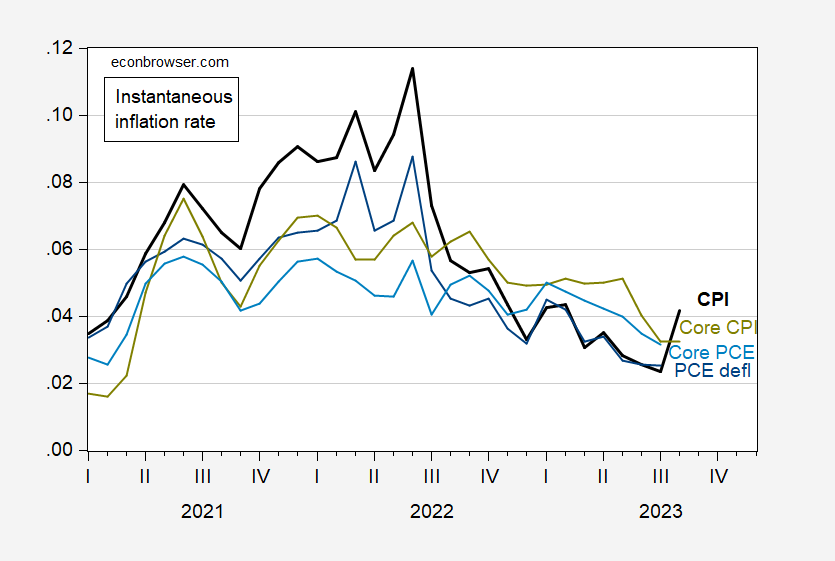
That being said, it’s useful to consult other measures of what the underlying inflation measures, both CPI and PCE deflator, say. In Figure 2, I show instantaneous (per Eeckhout, T=12, a=4) measures.

Figure 2: CPI headline instantaneous inflation (bold black), core CPI inflation (chartreuse), PCE deflator (blue), core PCE deflator (light blue),(per Eeckhout, T=12, a=4), all at annual rates. Source: BLS via FRED, and author’s calculations.
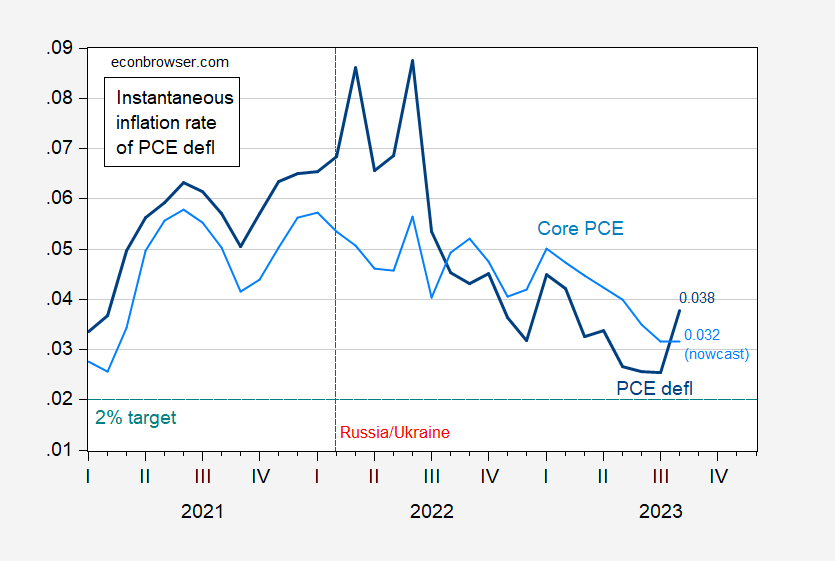
The CPI figures are key inputs into the Cleveland Fed PCE nowcasts. With the latest figures, we see have the following instantaneous inflation figures for headline and core PCE.

Figure 3: PCE deflator instantaneous inflation (bold blue), and Core PCE deflator inflation (light blue), per Eeckhout, T=12, a=4, at annual rates. August observation is based on Cleveland Fed PCE nowcast. 2% target teal dashed line. Source: BEA via FRED, Cleveland Fed nowcast accessed 9/14/2023, and author’s calculations.
If core PCE is what’s most important, the incoming data buttresses the case that trend inflation has come down, but progress toward further decrease is going to be halting.
More By This Author:
Calling Graduate Students Of The 1980’s…
How Much Have (Ex Ante) Real Rates Risen?
Recession Probabilities (Using Data Through End-2022)


