How Much Have (Ex Ante) Real Rates Risen?
Ten year Treasurys and Fed funds:

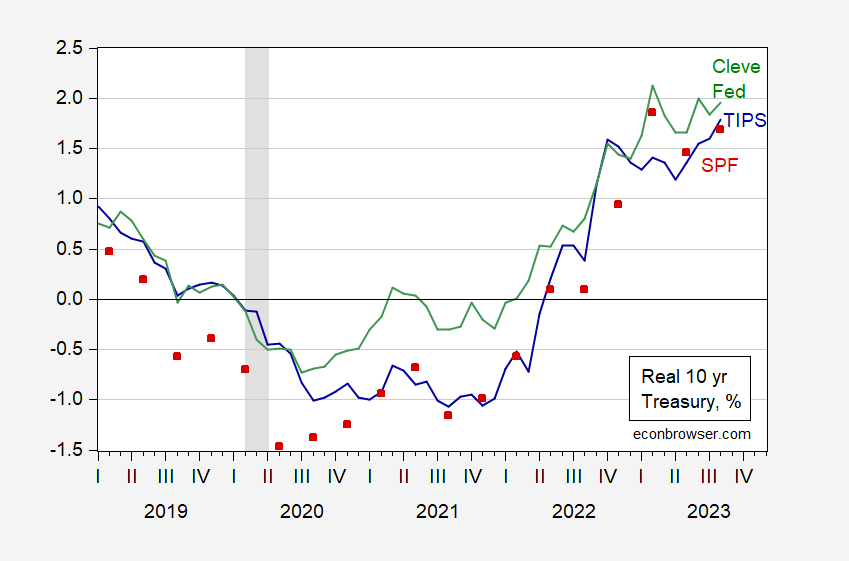
Figure 1: Ten year Treasury constant yield adjusted by ten year expected inflation from Survey of Professional Forecasters median (red square), from Cleveland Fed (green), and TIPS 10 year constant maturity yield, all in %. NBER defined peak-to-trough recession dates shaded gray. Source: Federal Reserve, Treasury via FRED, Philadelphia Fed, Cleveland Fed, NBER, and author’s calculations.
In real terms, rates have risen very rapidly from troughs. TIPS 10 year has risen 2.8 percentage points, 10 year adjusted by SPF by 3.06 points, 10 year adjusted by Cleveland Fed expectations by 2.7 points.

Figure 2: Fed funds rate adjusted by one year expected inflation from Michigan survey (blue), from NY Fed (tan), and from Cleveland Fed (green), all in %. NBER defined peak-to-trough recession dates shaded gray. Source: Federal Reserve, U. Michigan via FRED, Cleveland Fed, NBER, and author’s calculations.
The real Fed funds calculated using the Michigan survey has risen by 8.1 percentage points since trough (March 2022). Mixed information measures like the Cleveland Fed’s inflation expectations indicate a smaller yet still substantial increase of 5.7%.
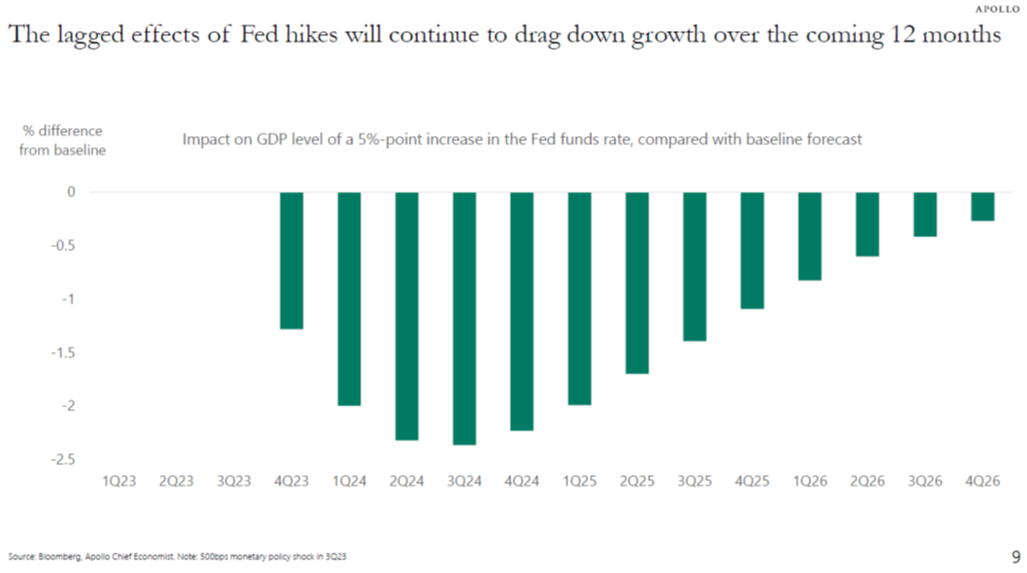
Torsten Slok provided an estimate of the impact on growth (deviation from baseline) resulting from a 500 bps increase in the Fed funds rate that occurred in 2023Q3.

Source: Slok, Outlook for public and private markets, Sept 2023 (Apollo).
Two complications: the estimate is for a 500 bps shock, whereas I’ve shorn real rate changes. And the real rate changes took place from 2022Q2 onward.
To me, this means we have a fair amount of drag hitting the economy even if the Fed were to stop raising the policy rate now.
More By This Author:
Recession Probabilities (Using Data Through End-2022)The Recession Of 2022H1 – Rec Vehicles, But No Spam
Term Spread Watch – Is This Time Different?


