
As forecasts are marked down (IMF releases new forecasts on Tuesday), here in two pictures is my answer:
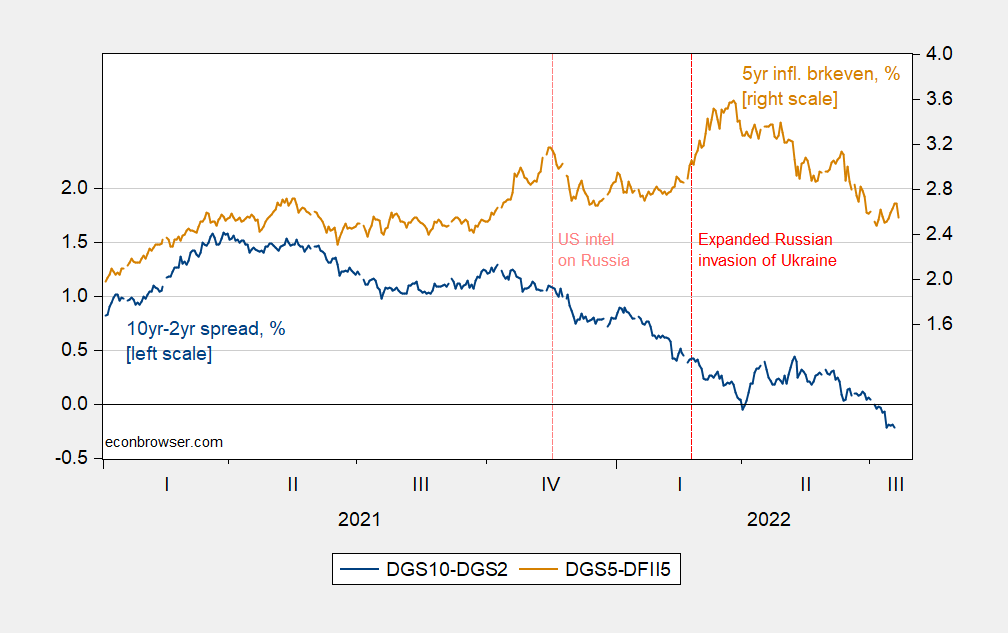
Figure 1: 10yr-2yr Treasury spread (blue, left scale), and 5yr Treasury-TIPS spread (red, right scale), both in %. Source: Treasury via FRED, and author’s calculations.
Inflation expectations at the 5-year horizon rise with the increasing perceived likelihood of an expanded Russian incursion into Ukraine, in early November. The 10yr-2yr spread also shrinks the. Inflation expectations again rise with the discrete elevation of aggression starting on February 24 (as oil prices move up).
Using the term spread, we can estimate probabilities of recession based on historical correlations. These are shown in Figure 2.
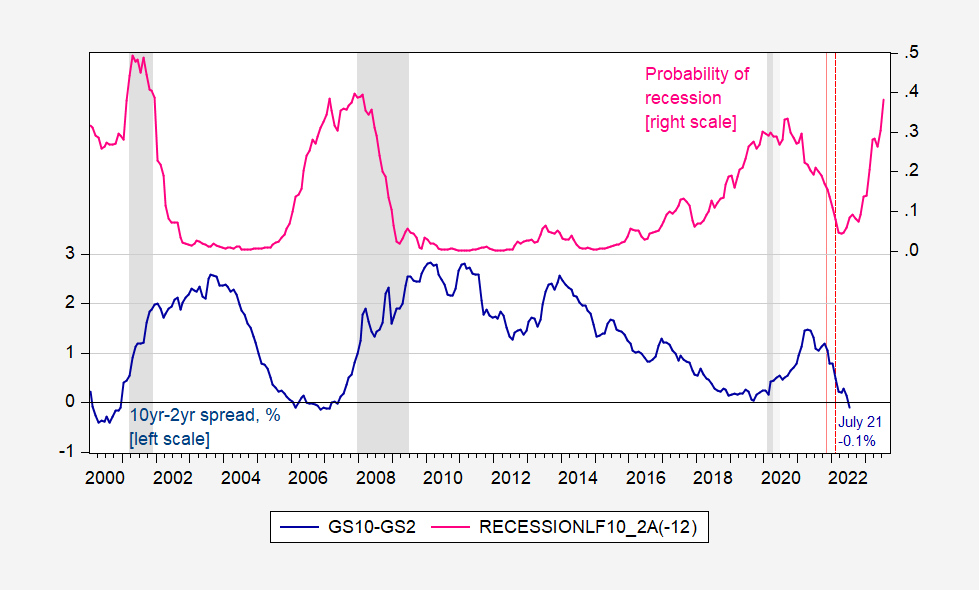
Figure 2: 10yr-2yr Treasury spread, % (blue, left scale), and spread based probit model recession probability 12 months ahead (pink, right scale). July data and probability based on data through 7/21. Dashed line at 2021M11, and 2022M02. NBER defined peak-to-trough recession dates shaded gray. Source: Treasury via FRED, NBER, and author’s calculations.
If one uses a 30% threshold for calling recessions (this catches essentially all past recessions, but also predicts a recession in 1999/2000), then we’re headed to one starting in June 2023.
One’s answer will differ depending on whether to use the 10yr-3mo instead of the 10yr-2yr. In addition, if you wondered if somebody’s policies enabled/encouraged Mr. Putin to engage in this expanded invasion of Ukraine, well, you might lay the blame somewhere else.
More By This Author:
Tracking the Russian Economy: Are Sanctions Working?Inflation, Gasoline, Recession
One Year CPI Inflation Expectations as of Mid-July


Comments
Log in or sign up to join the conversation.