
Inflation, Gasoline, Recession
I was on WPR’s Central Time today, discussing among other things: “Gas and oil prices are starting to come back down. We explore what that means for inflation and fears of a recession.”
Gasoline prices are continuing their downward move, down to $4.49 for week ending 7/18, down from $5.006 for week ending 6/13.
(Click on image to enlarge)
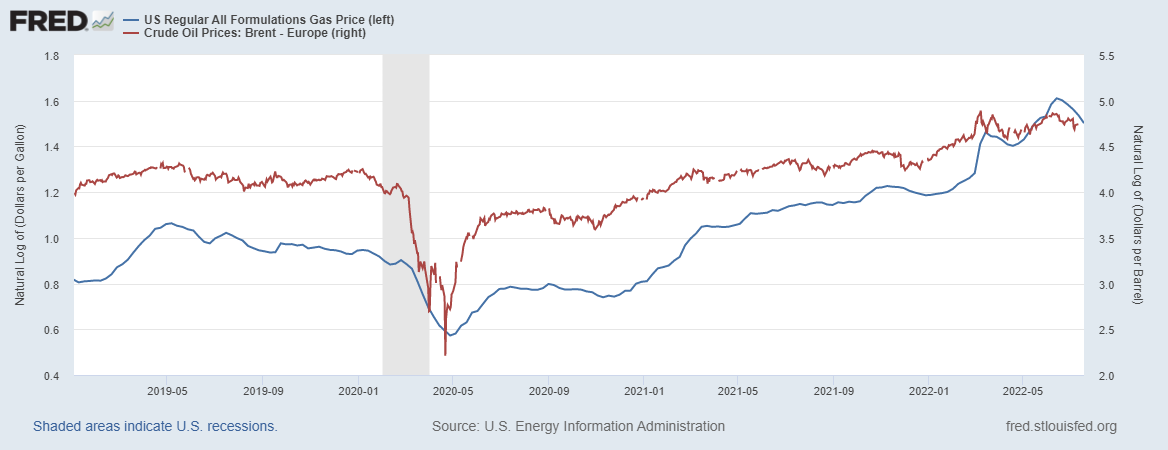
Source: EIA via FRED.
That’s a 10.3% decline in five weeks. Since gasoline accounts for 3.8% of the weight in the overall CPI bundle, a 10% decline over the month works out to about a 0.4 percentage point reduction in month-on-month inflation. June’s m/m inflation reading was 1.3%.
As noted in the past, the bulk of movements in gasoline prices is accounted for by oil prices (the remainder by refinery constraints). Here are futures for Brent as of today:
(Click on image to enlarge)
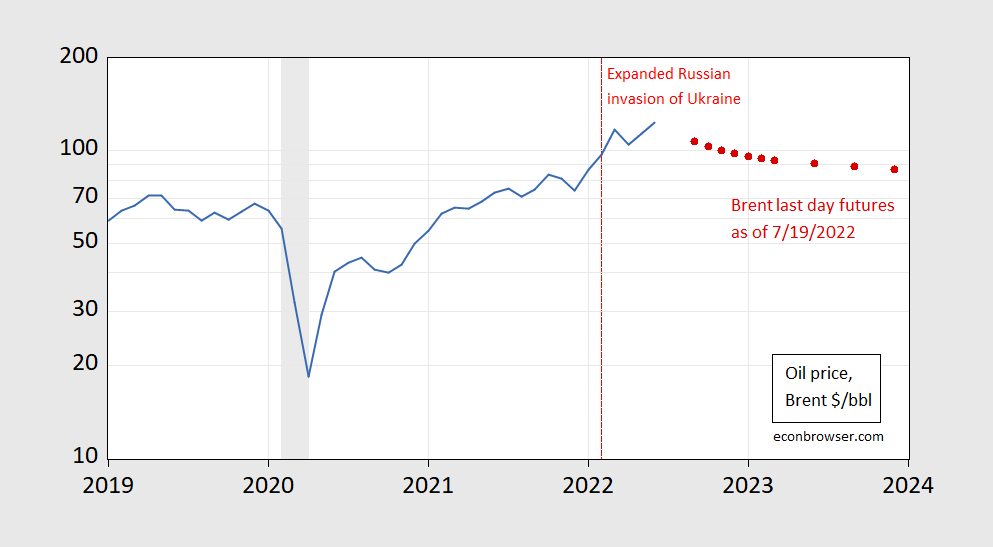
Figure 1: Price of oil, Brent (blue), and last day futures for Brent as of 7/19 (red square). NBER defined peak-to-trough recession dates shaded gray. Source: EIA, ino.com, NBER.
There are of course very wide confidence bands for the forecast based on futures. Using options data, EIA estimated back on 7/7:
(Click on image to enlarge)
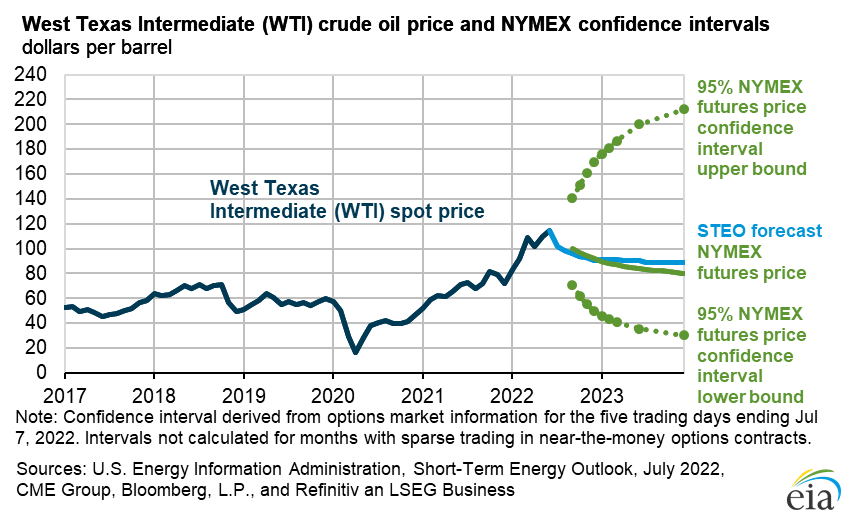
Source: DOE EIA Short Term Energy Outlook, accessed 7/19/2022.
Rob Ferrett, the host, also asked about recession, citing Jared Bernstein’s recent statement that it would be difficult to conclude the US was currently in recession. I agreed, we’re unlikely to have been in a recession in May or June (the latest monthly data we have), but many forecasters are predicting a recession in mid-late 2023. Based on the 10yr-2yr term spread, it also looks likely (despite the precipitous drop, the 10yr-3mo spread is still not flashing recession).
(Click on image to enlarge)
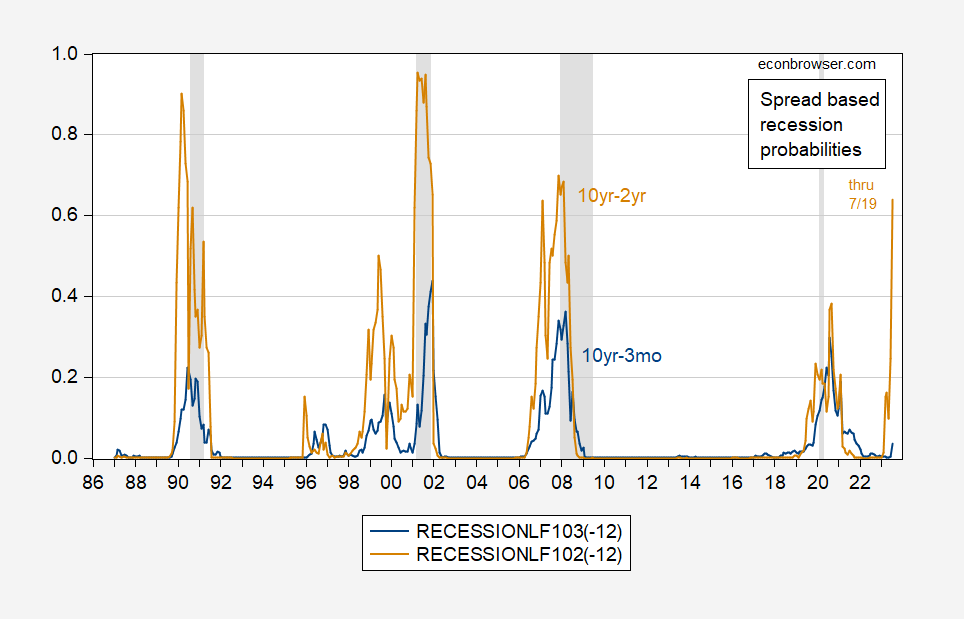
Figure 2: Probability of recession for indicated month, using 10yr-3mo spread (blue), using 10yr-2yr spread (brown). July 2022 observation based on data through 7/19. NBER defined recession dates peak-to-trough shaded gray. Source: Treasury via FRED, NBER, author’s calculations.
These probabilities are based on plain-vanilla probit regressions (at 12 month horizon) on term spreads for the 1986-2022 period. These spreads are shown below.
(Click on image to enlarge)
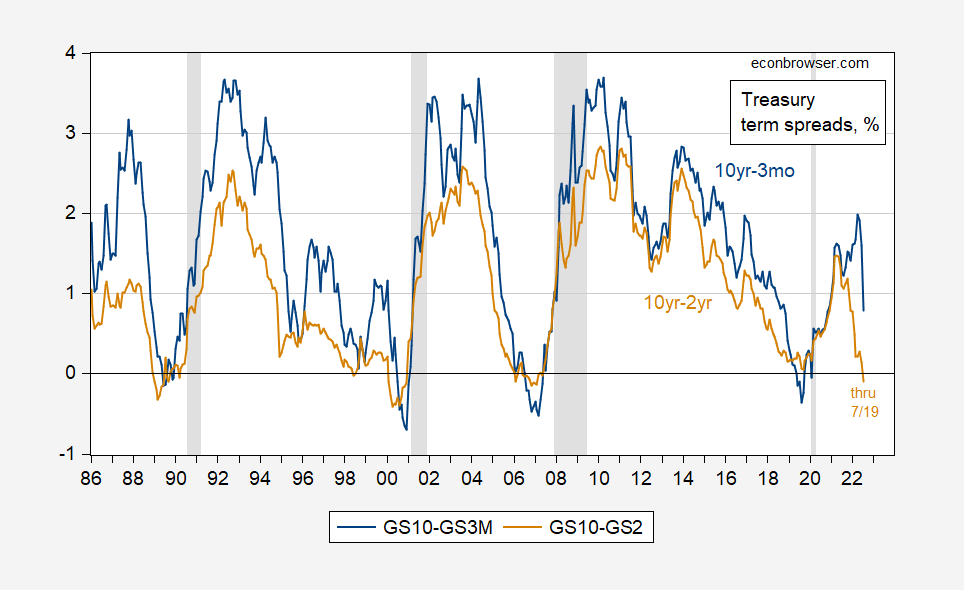
Figure 3: 10yr-3mo Treasury spread (blue), 10yr-2yr spread (brown), both in %. July 2022 observation based on data through 7/19. NBER defined recession dates peak-to-trough shaded gray. Source: Treasury via FRED, NBER.
The inversion in the 10yr-2yr spread implies a greater than 60% probability of recession in 2023M07. One caveat is that the 10yr-3mo spread is still positive, suggesting a much lower probability. The 10yr-2yr spread predicted most recessions, but not 2020 (using a 50% threshold), but also predicted the recession of 1999.
More By This Author:
One Year CPI Inflation Expectations as of Mid-JulyInflation In June
A Depressed Growth Trajectory: The Wall Street Journal July Survey
Disclosure: None.


