
Advance indicators for the goods trade balance came in today.

Figure 1: Trade balance in goods in bn$ SAAR (blue, left scale), and as share of monthly GDP (tan, right scale). NBER defined peak-to-trough recession dates shaded gray. BEA/Census, and Advance Economic Indicators, and IHS Markit, NBER, and author’s calculations.
Exports fell by 3.1%, and imports by 7.6% in value (dollar) terms (seasonally adjusted, m/m). Drops in both were broad-based, with consumer goods leading the drop in both, and automotive and related goods also leading in drop in imports.
Note that for both imports and exports, the goods movements dominate goods and services.
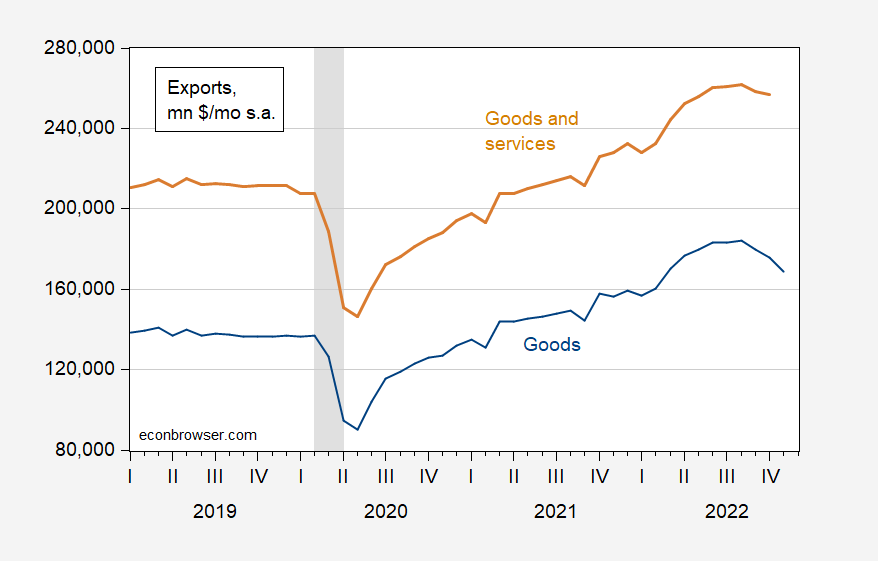
Figure 2: Exports of goods in bn$ SAAR (blue), and of goods and services (tan). NBER defined peak-to-trough recession dates shaded gray. BEA/Census, and Advance Economic Indicators, and NBER.
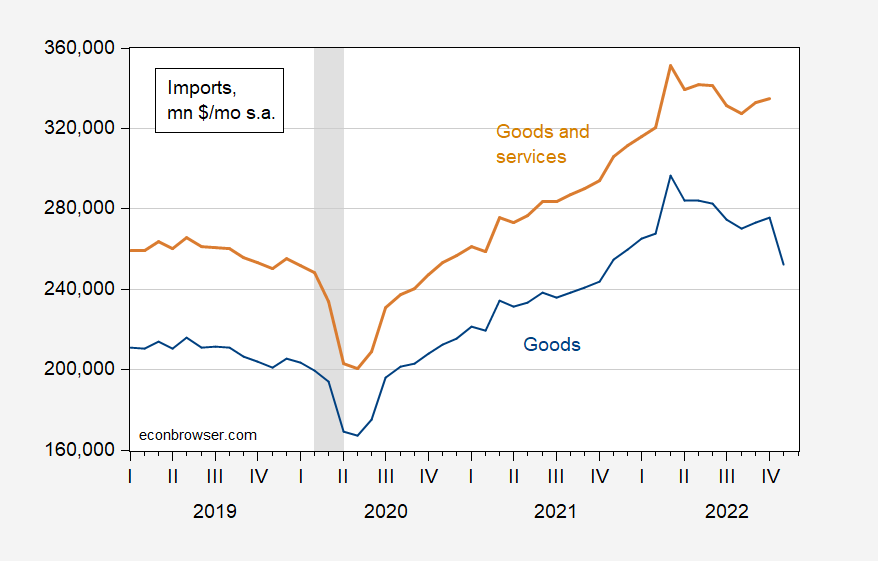
Figure 3: Imports of goods in bn$ SAAR (blue), and of goods and services (tan). NBER defined peak-to-trough recession dates shaded gray. BEA/Census, and Advance Economic Indicators, and NBER.
Goldman Sachs increased their tracking estimate for Q4 GDP to 2 ppts q/q SAAR, by 0.3 ppts, on the basis of the sharp drop in imports.
Note that while a smaller than expected imports raises the nowcast of GDP conditional on other indicators (i.e., in an accounting or “bean counting” sense), falling imports behaviorally implies slower economic growth (holding constant expenditure switching effects — but the dollar has been pretty consistently strong for months).
More By This Author:
Chinese GDP Growth Over The Xi Jinping Era
Maximum AUROC Spreads: Recession Ahead, And If So, When?
The Coming Macro Shock of 2023: China


Comments
Log in or sign up to join the conversation.