
Over this period, growth has generally surprised on the downside.
Here is GDP expressed in constant 2015CNY, along with IMF World Economic Outlook October forecasts.
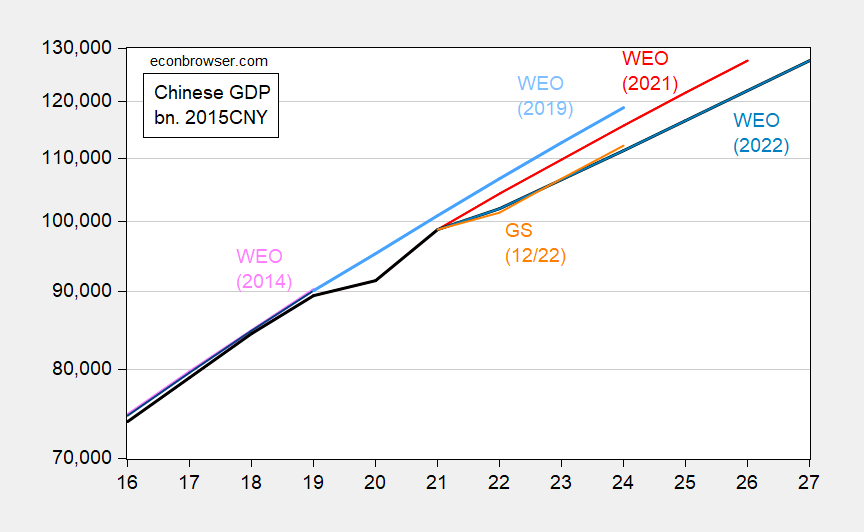
Figure 1: Chinese GDP from October 2022 WEO (black), October 2022 forecast (gray-blue), October 2021 forecast (red), October 2019 forecast (sky blue), October 2014 forecast (pink), Goldman Sachs 22 December 2022 forecast (orange), all in bn 2015CNY, on log scale. Source: IMF World Economic Outlook databases (October, various issues), Goldman Sachs 12/22/2022.
For a different perspective, I show actual GDP growth (in log differences) since 1991 (as reported, in black), and forecasts from the corresponding World Economic Outlook forecasts.
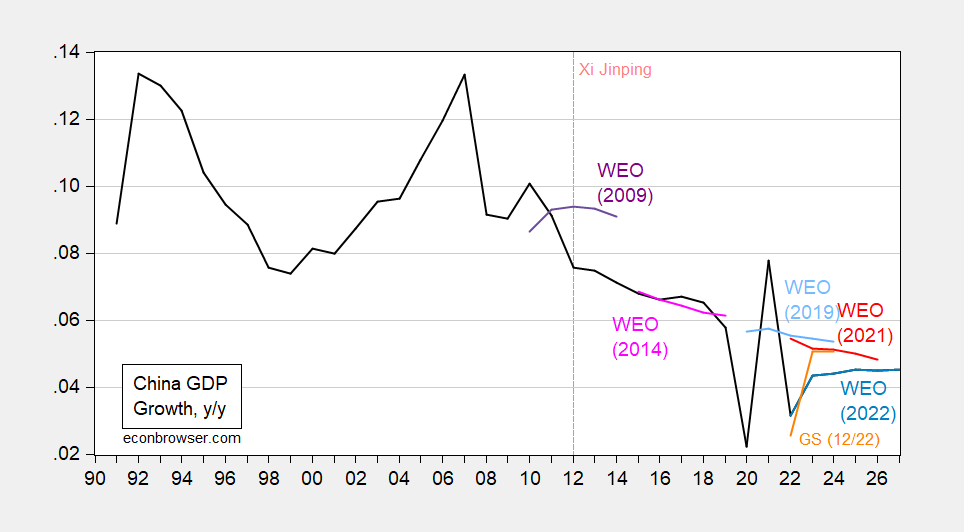
Figure 2: Year-on-year Growth of Chinese GDP from October 2022 WEO (black), October 2022 forecast (gray-blue), October 2021 forecast (red), October 2019 forecast (sky blue), October 2014 forecast (pink), Goldman Sachs 22 December 2022 forecast (orange), all in bn 2015CNY, on log scale. Source: IMF World Economic Outlook databases (October, various issues), Goldman Sachs 12/22/2022.
The World Bank has just marked down 2022 y/y growth to 2.7%, Goldman Sachs down to 2.6%, while the IMF WEO forecast 3.2% in November.
If you don’t think 3.2% vs. 10% in 2010 (or the 5.5% target) isn’t “hitting a wall”, I don’t know what is.
In my view, this is not a good thing. A prosperous global economy needs a growing Chinese economy — so no schadenfreude here (although more appropriate would be to write 没有 幸灾乐祸 ).
More By This Author:
Maximum AUROC Spreads: Recession Ahead, And If So, When?
The Coming Macro Shock of 2023: China
Month-on-Month PCE Deflator Inflation: Has The Regime Switched?


Comments
Log in or sign up to join the conversation.