
In 2019, Fed economist David Miller undertook a comprehensive assessment of term spread predictive power for recessions (There is No Single Best Predictor of Recessions). For the 1984-2018 period, he found the following:
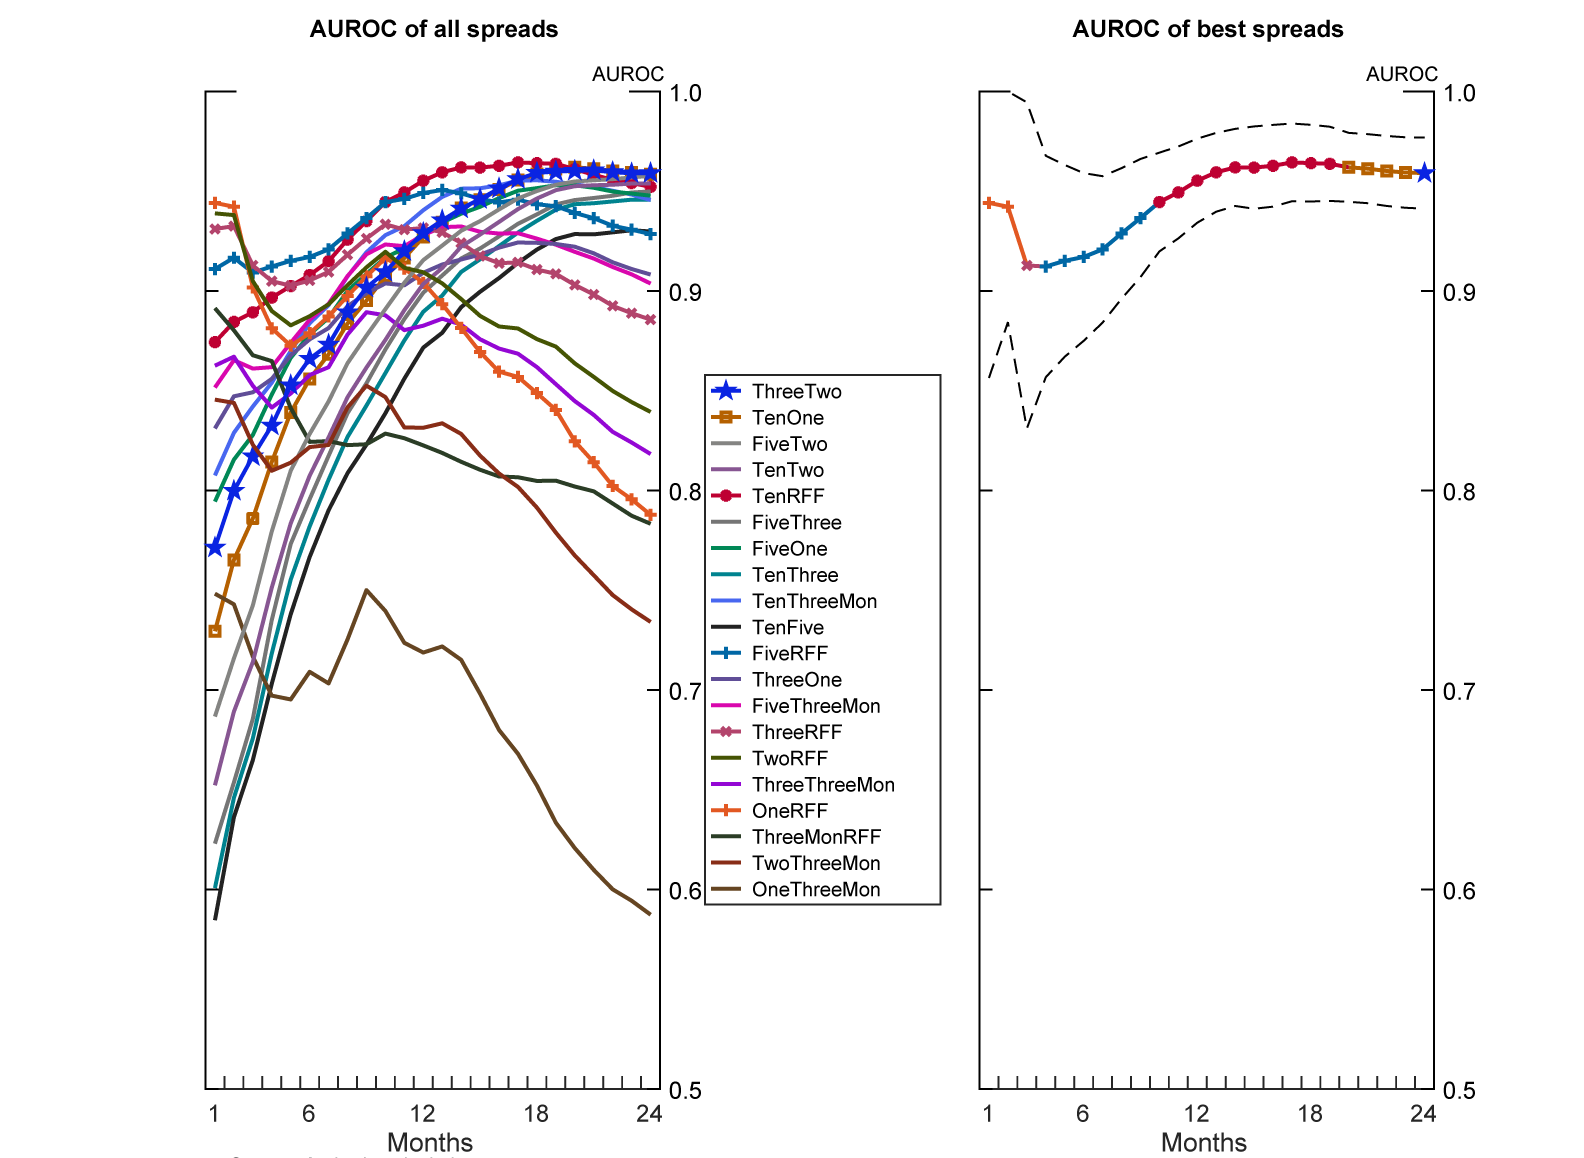
Figure 2: AUROC Sample 1984 – 2018 from Miller (2019).
For a discussion of AUROC (Area Under Receiver Operating Characteristics curve), see this post by Jim H.
What do these spreads look like as of Friday (color coordinated to match the graph above?):
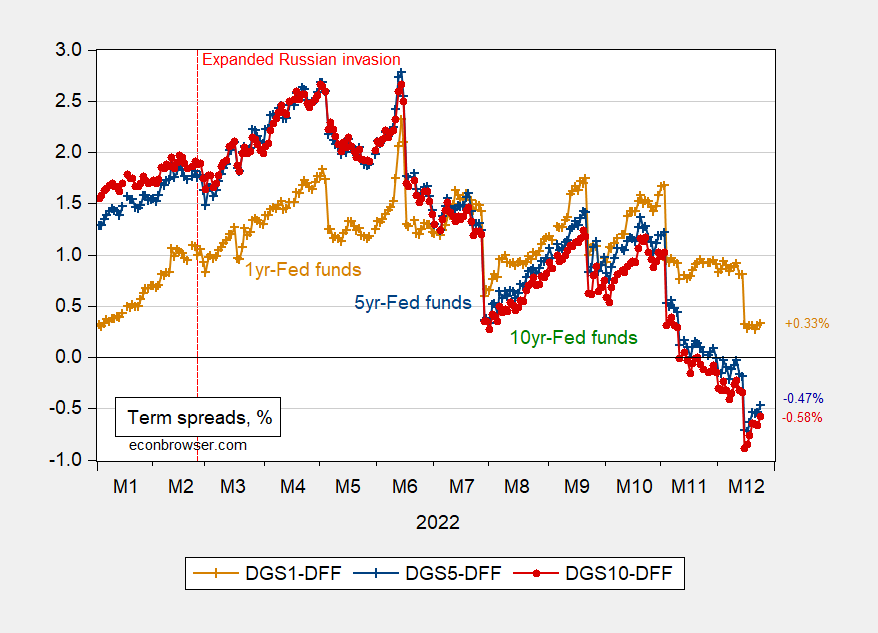
Figure 1: 1yr-Fed funds spread (chartreuse), 5yr-Fed funds (red), 10yr-Fed funds (bold teal), 10yr-1yr (sky blue), and 3yr-2yr (purple), all in %. Red dashed line at expanded Russian invasion of Ukraine. Source: Treasury via FRED, and author’s calculations.
The 1yr-Fed funds spread (1-2 month horizon) has not gone negative, although the 5yr-Fed funds spread (4-9 months) has since the last post on this subject a month ago. The 10yr-Fed funds spread (10-19 months) did end negative on November 10th, which would suggest that somewhere between September 2023 and August 2024 a recession would occur. The 10yr-1yr has also registered negative on July 12th, so between 20 and 23 months ahead (February to May 2024).
Note that these are maximum AUROCs for simple term spread models. They do not incorporate foreign term spreads (as suggested by Ahmed and Chinn, 2022), nor a factor based on disaggregated sectoral dividend yield ratios (as suggested by Chatelais, Stalla-Bourdillon, and Chinn, 2022).
More By This Author:
The Coming Macro Shock of 2023: ChinaMonth-on-Month PCE Deflator Inflation: Has The Regime Switched?
GDP 3rd Release, GDO, GDP+, GDPNow


Comments
Log in or sign up to join the conversation.