Fun (Or Lack Thereof) With Advance-Declines
Image Source: Unsplash
In theory, if not in practice, moves in major indices should be confirmed by breadth. We tend to focus on indices that are weighted by market capitalization, so many choose to check to see whether a wide range of stocks are participating in a rally that might be disproportionately led by the largest companies. The current environment features one of the most top-heavy index compositions in decades, meaning that a least recently, breadth hasn’t mattered. But historically it has, so we would like to check whether broad-based indices and advance-decline measures are keeping pace with the more concentrated indices.
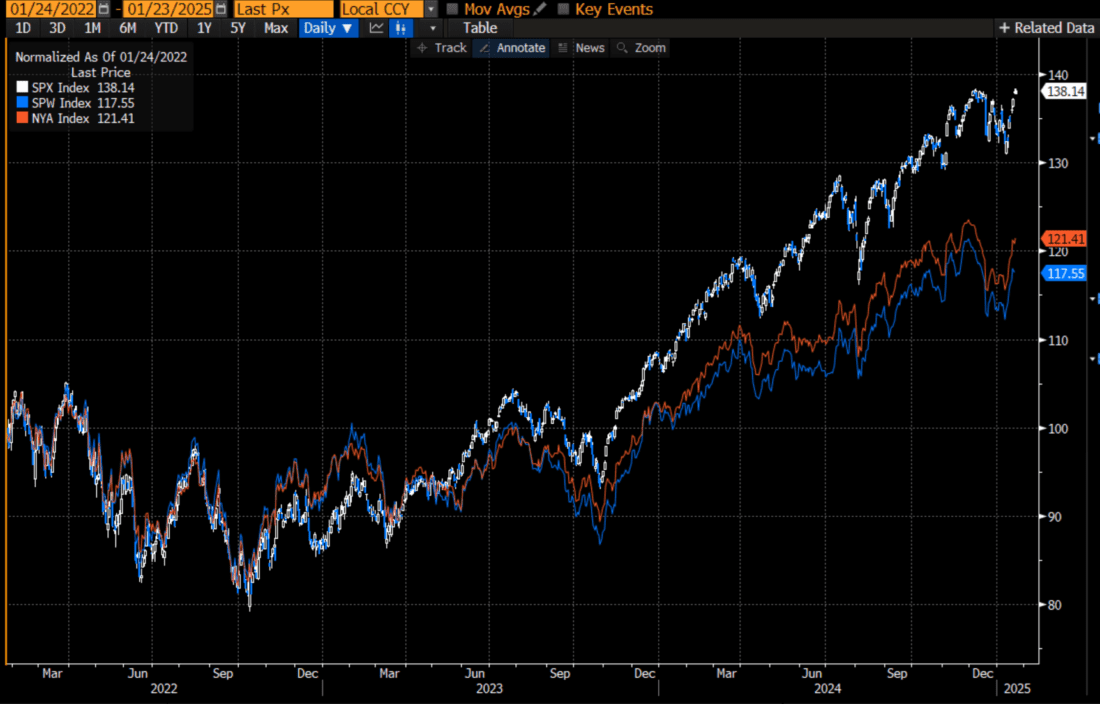
One simple way to examine the relative amount of market participation is to compare the S&P 500 (SPX) with its equal-weighted version (SPW) and the NYSE Composite Index (NYA). We see that the latter two measures have performed similarly, but significantly worse than SPX:
3-Years, SPX (blue/white candles), SPW (blue line), NYA (red line)
(Click on image to enlarge)
Source: Bloomberg
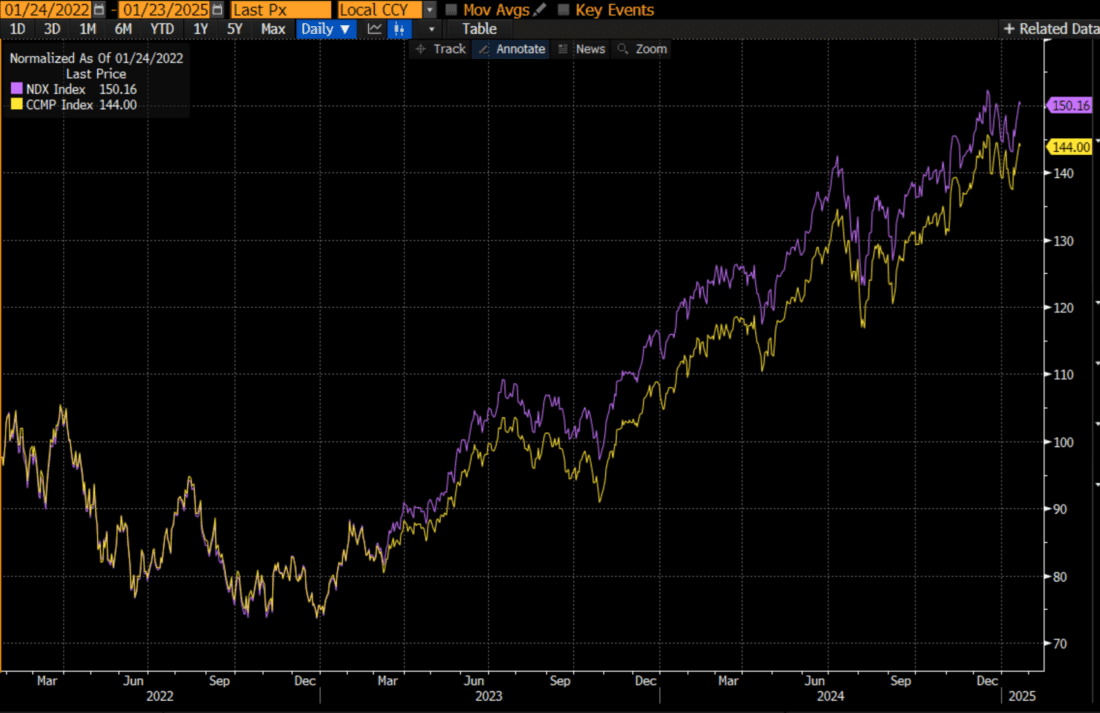
Interestingly, when we compare the Nasdaq 100 (NDX) to the Nasdaq Composite (CCMP), the performance gap is far narrower.Part of the reason for CCMP’s better tracking vs. NDX as opposed to NYA’s tracking vs. SPX is because the megacap technology that are dominating that index are all Nasdaq listed:
3-Years, NDX (purple), CCMP (yellow)
(Click on image to enlarge)
Source: Bloomberg
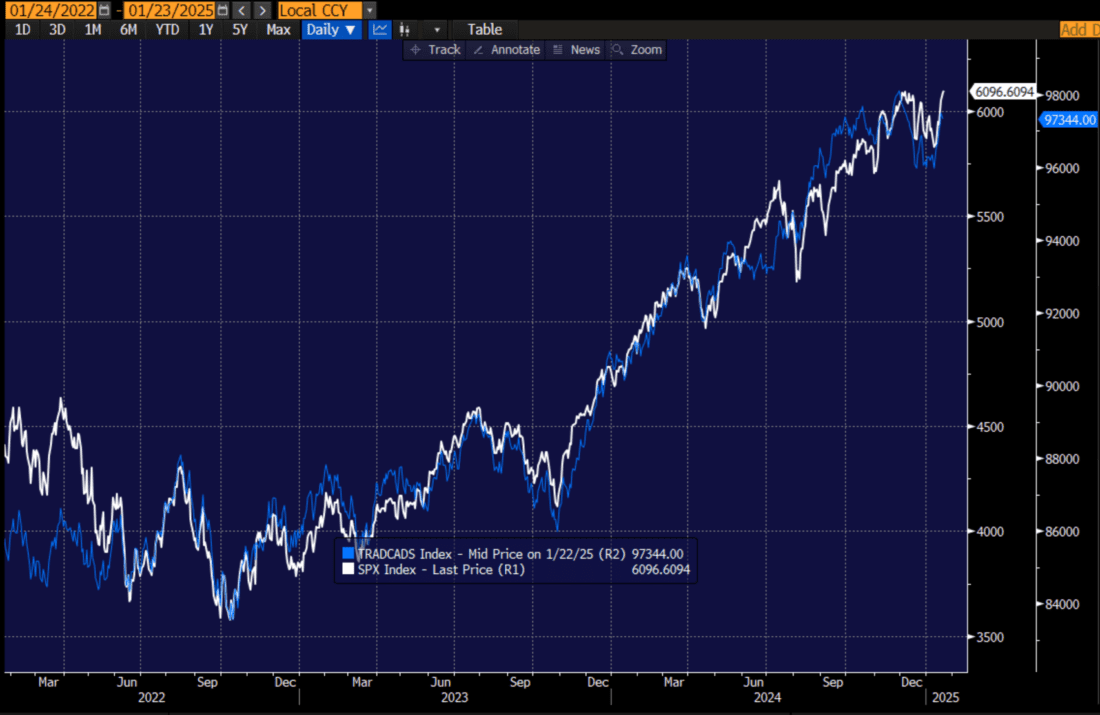
Within the indices some advance-decline lines are keeping up with their benchmarks much better than others. For example, when we compare SPX to its cumulative advance-declines, we see that while the latest rally is not quite confirmed by the A/D line, it is not that far off.This comes, mind you, after a period in December when we went weeks with SPX decliners outpacing advancers, even as the index rose:
3-Years, SPX (blue), Cumulative SPX Advances-Declines (white)
(Click on image to enlarge)
Source: Bloomberg
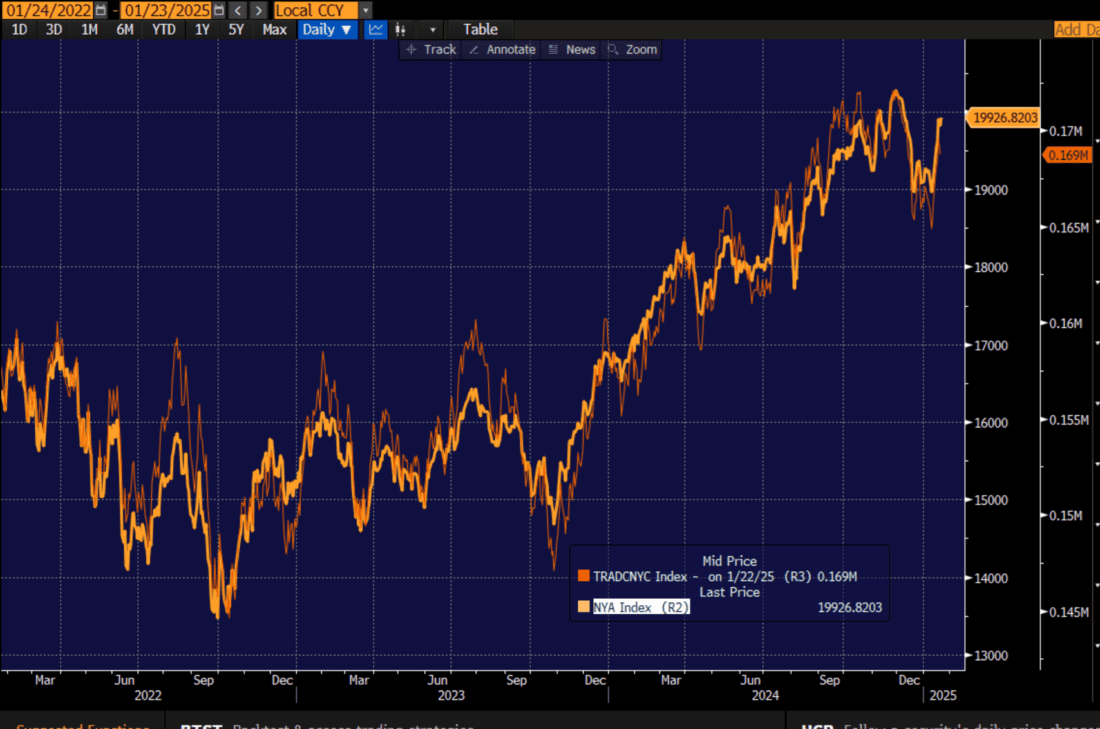
We see something similar with NYA and the NYSE cumulative A/D line:
3-Years, NYA (orange), NYSE A/D line (red)
(Click on image to enlarge)
Source: Bloomberg
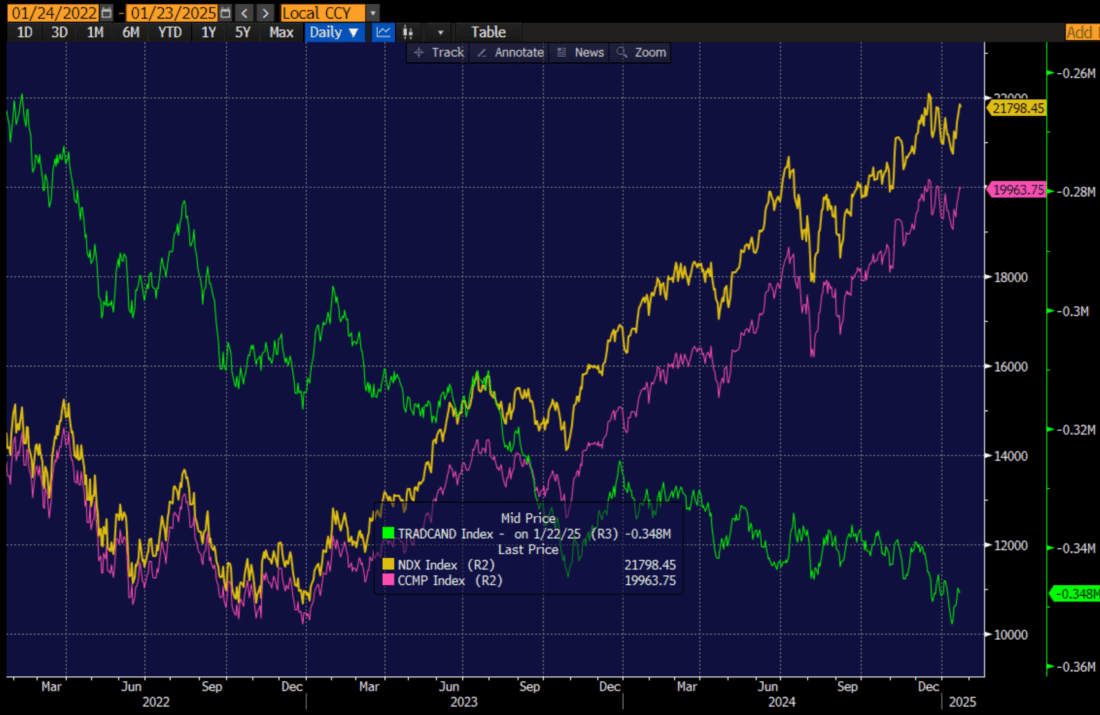
Yet by the same measure, both NDX and CCMP fall far short.The Nasdaq cumulative A/D line has seemingly been in freefall even as the indices soar.That said, this has been occurring for years with few ill effects, if any:
3-Years, NDX (yellow), CCMP (magenta), Nasdaq Cumulative A/D (green)
(Click on image to enlarge)
Source: Bloomberg
Bottom line: for the most part, breadth has been keeping up with major indices. Certainly, there is underperformance when we compare SPW to SPX, and the drop in the Nasdaq A/D line is quite staggering, but on the whole, these should not be cause for immediate concern. Yet we have seen some index dips when the A/D lines fail to confirm new highs.It bears watching but not panic.
More By This Author:
Stock Traders Once Again Reveal Their Liquidity AddictionJensen Huang’s Quantum Splash Of Cold Water
Options Market Expectations For The Payrolls Report
Disclosure: The analysis in this material is provided for information only and is not and should not be construed as an offer to sell or the solicitation of an offer to buy any security. To the ...
more


