
If you want to find out what is causing inflation… and why it won’t be going away anytime soon no matter what the Fed does, look no further than the below chart.
This is a chart of government spending since 2013. As you can see, government spending was in a clear trend right up until the pandemic, at which time it went absolutely bonkers.
(Click on image to enlarge)
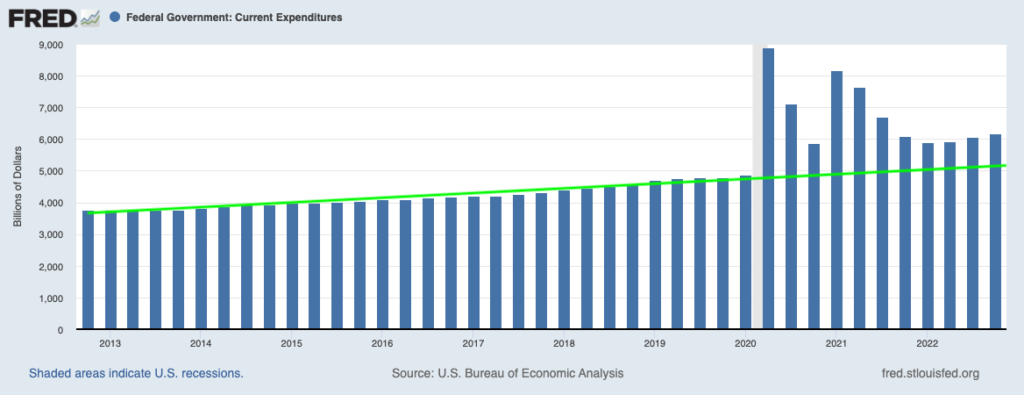
Now, according to the economic data, the recession triggered by the pandemic ended in June 2020. And yet, both the Trump and the Biden administrations continued to spend at a pace FAR exceeding the historic trend.
How much exactly?
Some $20 TRILLION, or roughly 87% of U.S. GDP.
Bear in mind, we’re not talking about $20 trillion in total spending… we’re talking about $20 trillion in ABOVE-trend spending by the government.
Even worse, there is no sign that this above-trend spending is slowing down. If anything, it’s starting to accelerate again.
So, the Fed can raise rates and shrink its balance sheet all it wants. It won’t accomplish much while the government is pumping an extra $1+ TRILLION in above-trend spending into the economy every single year.
And rest assured, this spending isn’t going into productive endeavors. It’s going into paying people not to work, boondoggles, and various inflationary schemes.
Want to end inflation? Stop overspending and printing money. It’s really quite simple.
More By This Author:
The Fed’s Worst Nightmare (A Wage Spiral) Has Officially ArrivedThe Next Major Threat to Your Portfolio Just Arrived
Buckle Up, The Bond Market Is About To Break A Major Central Bank


Comments
Log in or sign up to join the conversation.