

Image Source: Pixabay
Market Brief – Fed Cuts & Mega Earnings
This week, the Federal Reserve acted as expected, cutting its benchmark interest rate by 25 basis points on Wednesday to a target range of 3.75% to 4.00%. Alongside the cut, the Fed announced a halt to its balance sheet runoff, effectively ending quantitative tightening (QT). Both moves were significant shifts away from policy restraint toward support, the subject of this week’s newsletter.
While the rate cut was widely expected, off-the-run labor data have shown signs of softening, particularly in the small business side of the economy. Typically, such slides often act as a pre-recessionary indicator, suggesting the Fed’s actions are likely pre-emptive in nature.

While Inflation data remains above the Fed’s target, recent softness gives the Fed room to pivot. For the market, the end of QT came as liquidity conditions in the Treasury and repo markets began to tighten, with funding stress building. The Fed appears to have acted preemptively, choosing to preserve market function and prevent another 2019-style disruption.
Markets responded negatively to the news, with equities selling off and bond yields rising. However, this was mainly the result of a “buy the rumor, sell the news” outcome as both stocks and bonds had rallied strongly heading into the meeting. Part of the selloff was also due to the removal of the certainty of a December rate cut.
Lastly, Mega-cap earnings added to the week’s focus. Five of the largest market-cap companies reported Q3 results:
- Apple (AAPL) posted strong results, with revenue up 10% year-over-year and earnings per share rising to $1.57. Services revenue hit a new record.
- Amazon (AMZN) beat expectations on AWS growth and issued solid Q4 guidance, projecting $206 billion to $ 213 billion in revenue.
- Meta (META) delivered 26% year-over-year revenue growth, but profit fell due to a $1.6 billion one-time tax charge and higher costs. The stock declined post-report.
- Microsoft (MSFT) showed strong demand in its cloud segment, but growth was steady rather than accelerating.
- Alphabet (GOOG) beat on topline revenue but missed slightly on cloud margins, which pressured the stock.
Earnings season overall remains positive. According to FactSet, nearly 85% of S&P 500 companies that have reported so far have beaten EPS estimates, as shown. The blended year-over-year earnings growth rate for Q3 sits at 10.7%, with revenue growth at 7.9%. While growth is down from peak levels, it remains healthy by historical standards. That backdrop remains supportive of equities heading into year-end, particularly as corporate share buybacks of $6-7 billion daily will resume in November.

The combination of a Fed pivot and decent earnings remains supportive of asset prices currently. Still, the durability of the rally will depend on how the economy and inflation trend into year-end.
Technical Backdrop – Breadth Tumbles
The S&P 500 closed the week at 6,840 after making an all-time high on Tuesday. The breakout above the previous highs, following a successful test of the 50-day moving average (DMA), confirmed the continuation of the bullish trend. That move also reaffirmed support at key levels, particularly the running bullish trend line and the 20-DMA. The index remains above both the 50- and 200-day moving averages, both of which are trending higher, also supporting the bullish backdrop. Momentum has shifted positively, with the MACD triggering a fresh buy signal; however, there are concerns worth noting.
(Click on image to enlarge)

Breakouts to new highs typically draw in momentum buyers, yet this time has been different. Relative strength remains in a negative divergence to the S&P 500, and overall market breadth remains concerning. As shown, over the last week, the percentage of stocks in the S&P 500 index trading above their respective 50-, 75-, and 150-day moving averages has fallen sharply. Only 62.6% of S&P 500 components are trading above their 200-day moving average. That is a sharp decline from earlier this year and signals that fewer names are driving the rally. As price moves higher, participation narrows—a sign of fragility. The advance-decline line has also failed to confirm the new highs, flashing a classic divergence. Volume has been lighter on up days, adding to concerns about conviction.
(Click on image to enlarge)

Technically, this backdrop is bullish, but not strong. Breadth weakness, momentum divergence, and low-volume rallies suggest that the foundation beneath the breakout is thin. Price is moving higher, but without broad participation, the move becomes more vulnerable to sharp reversals.
Support and Resistance Levels:
- Resistance: ~6,850–6,900 (top of rising trend channel)
- First Support: ~6,740 (20-day moving average)
- Second Support: ~6,650 (50-day moving average)
- Crucial Support: ~6,100–6,200 (structural breakout level and 200-day moving average)
In this environment, investors should manage equity exposure with discipline. Participate in the trend, but stay alert. Without a broader base of participation, this rally could struggle to sustain momentum. If earnings and economic data don’t confirm price action, the risk of reversal will grow. Trim extended positions, tighten stops, and stay tactical.
Key Catalysts Next Week
The week ahead will be a critical test for the recent rally in equities. With the Federal Reserve having shifted policy and major macroeconomic data releases disrupted by the ongoing federal shutdown, market focus now turns to corporate earnings and the few economic indicators still scheduled for release.
(Click on image to enlarge)

With the mega-cap tech earnings cycle behind us and economic data flow restricted, the spotlight shifts to the next tier of corporate results and private-sector indicators. Earnings from Uber and Disney will provide critical insights into consumer behavior, while Qualcomm and Palantir offer valuable information on business investment and government technology demand.
Furthermore, the ISM Manufacturing and Services reports will be closely watched, as they are among the few reliable macroeconomic signals this week. These surveys can influence sentiment on inflation trends, demand strength, and pricing pressure, all key inputs for market expectations around the Fed’s next moves.
With valuations stretched and participation narrow, the bar for positive surprises is high. Strong reports could reinforce bullish momentum, but any signs of weakness or cautionary forward guidance could quickly undermine confidence.
Trade accordingly.
Need Help With Your Investing Strategy?
Are you looking for comprehensive financial, insurance, and estate planning services? Need a risk-managed portfolio management strategy to grow and protect your savings? Whatever your needs are, we are here to help.
Fed QT Ends
On Wednesday, the Federal Reserve delivered a 25 basis-point rate cut and ended quantitative tightening. The funds rate now sits between 3.75% and 4.00%. The balance sheet runoff, which had drained over $1.2 trillion in liquidity since June 2022, has officially stopped. That marked a clear pivot from policy restraint to policy accommodation.
(Click on image to enlarge)

The move was unsurprising, as the markets had anticipated it since the beginning of the “tapering” in 2022. With each FOMC meeting, the markets rallied in hopes that the Federal Reserve would cut rates further and eventually, while not yet, return to “QE.” The initial reduction in the Fed’s “QT” early was the first step, and now the end of QT entirely puts the Fed much closer to the market’s aspirations.
However, investors should ask an obvious question. With the market pushing all-time highs, valuations stretched, credit spreads tight, and jobless claims remaining very low, why provide accommodation now?
The answer lies beneath the surface.
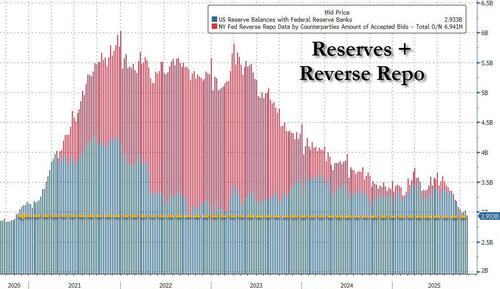
Fed officials had grown increasingly concerned about reserve scarcity. The rapid pace of QT and a heavy Treasury issuance calendar increased the risk of a collateral shortage. Repo rates spiked in mid-October. SOFR crept above the fed funds target. Market-based stress measures suggested a potential breakdown in overnight funding conditions. The plumbing was cracking, even as asset prices looked strong. This was the same environment we had seen in the summer of 2019, although not yet to the same level of concern.
The combination of reserves and reverse repos is now at its lowest level since 2020, resulting in a creeping increase in the SOFR rate. This aligns with the Fed’s long-standing plan to end the balance sheet drawdown once the level of reserves hits current levels. The Fed also wants to shift to a Treasury-only balance sheet. This is a crucial point, as it means that while the Fed will no longer reduce its Treasury holdings, it will continue to allow mortgage-backed securities (MBS) to roll off. For the Treasury market, the Fed will buy the same amount of new Treasuries as the ones that mature.
The decision to end QT was a response to that liquidity pressure. The Fed has a long memory. In 2019, it waited too long to react to reserve scarcity, which triggered chaos in the repo market and forced an emergency balance sheet expansion. This time, Powell and his colleagues are choosing to act before a funding market eruption.
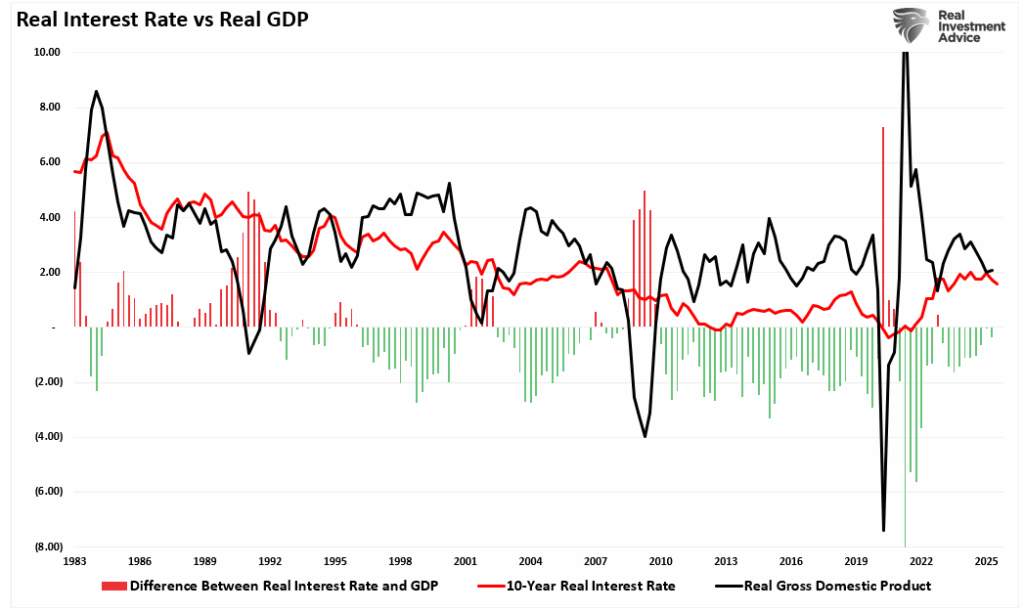
The rate cut was equally preemptive. Real rates are elevated, and inflation-adjusted yields on the 10-year Treasury approached 2% last month, the highest since 2007. At the same time, economic momentum slowed as consumer confidence slipped. These indicators told the Fed that underlying demand was cooling; therefore, the cut was likely to ease financial conditions without waiting for more visible cracks.
(Click on image to enlarge)
Powell has previously framed these actions as “risk management.” He has also noted that monetary policy acts with a lag and that the full effects of prior tightening are still filtering through. In other words, the Fed doesn’t want to tighten into a slowdown it cannot yet see. It’s also clear that the Fed is targeting broader liquidity health. Cutting rates and halting the Fed’s QT signals that monetary conditions are now meant to support—not restrain—the system.
That doesn’t mean the Fed is aiming for a new bull market. This is not QE or ZIRP. The Fed is still monitoring inflation, but its priority has shifted, and stability in financial markets now takes precedence over the residual fight against inflation. Liquidity fragility, rather than asset prices, compelled the Fed’s hand.
The implications for investors are clear. The regime has shifted, and the Fed no longer wants to be a headwind, even though markets have largely ignored it. What is important is that it does change how capital is priced, how credit is extended, and how markets behave over the next several months. Liquidity is no longer contracting, and the Fed is no longer out of the market.
So, what does this all mean for the stock and bond markets?
What the Fed’s Pivot Means for Stocks
The end of QT and a 25-basis-point rate cut altered the dynamics for the equity market. For the past 18 months, financial conditions had tightened steadily. Higher rates increased the cost of capital, while balance sheet runoff drained liquidity. That regime has ended, and as shown in the chart below, monetary policy is now the most dovish in years.
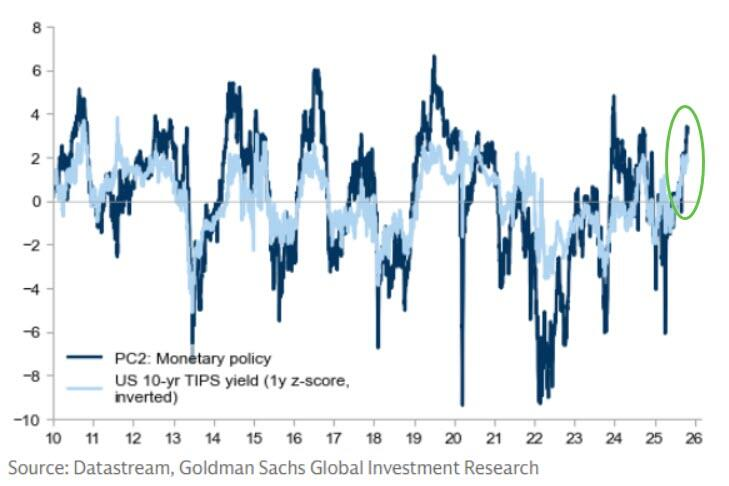
Investors must understand that stocks now trade in an environment where Fed policy supports risk-taking. While the Fed’s move was not designed to ignite an asset boom, the side effects are unavoidable, particularly when liquidity matters more than fundamentals. And for now, liquidity is back.
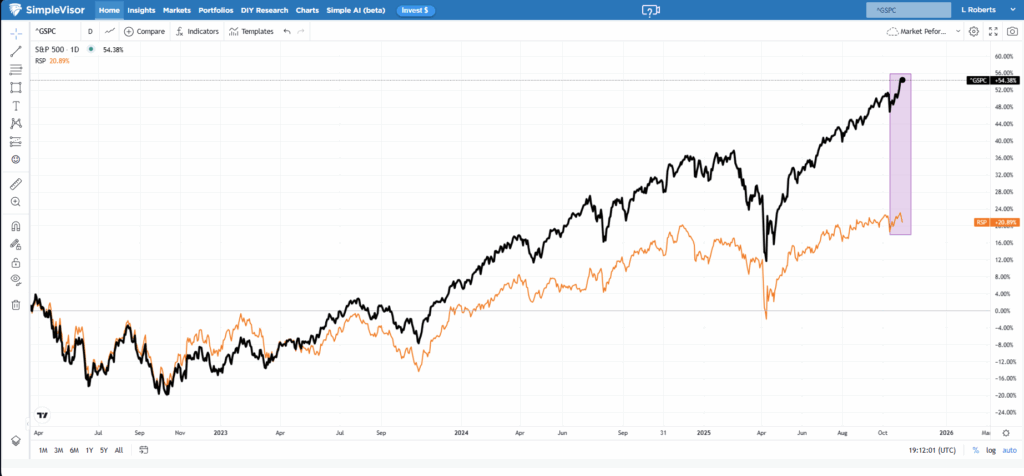
Immediately after the announcement, stocks sold off, which is unsurprising given the recent run-up to all-time highs. It was a bit of “buy the rumor, sell the news.” Nonetheless, in previous days, growth stocks grossly outperformed, particularly in the “Magnificent 7,” which have driven the broader indices. As we discussed on Wednesday, the Megacap ETF (MGK) is grossly overbought on a relative and absolute basis. At the same time, more defensive market areas, such as low volatility (SPLV), are deeply oversold. (Chart courtesy of SimpleVisor.com)

That bifurcation in the market reflects a clear shift in investor psychology, where looser financial conditions and more policy support support higher valuations. That is a risk if economic data deteriorates or earnings growth slows. Nonetheless, while already elevated, valuation multiples are likely to expand under these conditions. The forward price-to-earnings ratio for the S&P 500 already sits above 23 and only slightly below the 2021 “stimulus-fueled” peak. With a lower discount rate and an end to the liquidity drain, the question is whether multiples can continue to climb, especially for high-duration assets such as technology and biotech. That doesn’t mean earnings justify the move, but liquidity flows tend to override earnings concerns, at least in the near term.
(Click on image to enlarge)

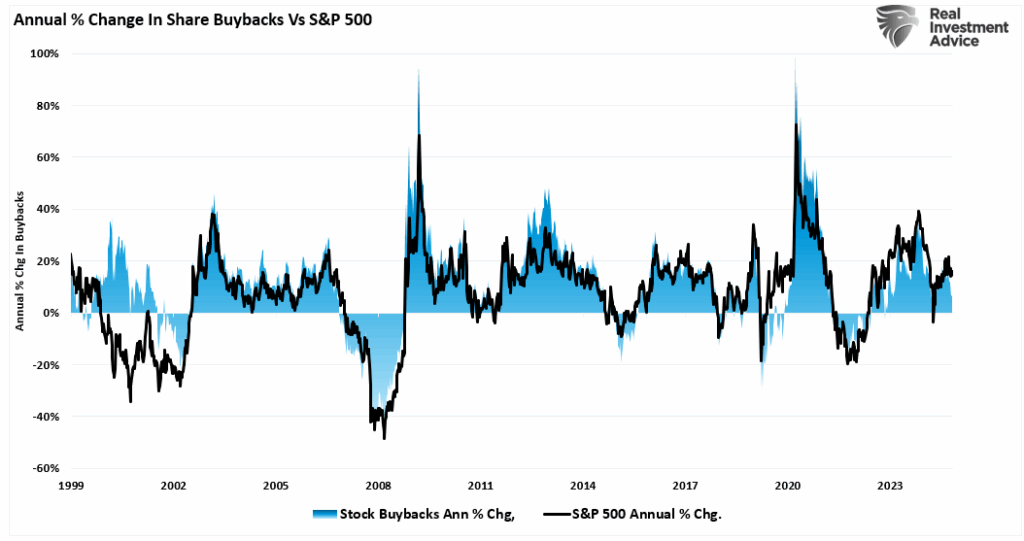
Corporate buybacks may also accelerate. With lower yields and a more stable funding backdrop, companies will have more flexibility to return capital. As noted in “3-Reasons To Buy Dips,” corporate share buybacks add a significant buyer to the market of roughly $6-7 trillion per day through year-end.
(Click on image to enlarge)
Given this backdrop, we will likely continue to see a divergence between the Mega-cap index (driven by passive investing flooding money into the largest companies) and the Equal-weight index, given the market’s dearth of breadth.
(Click on image to enlarge)
However, investors should not confuse an easier policy with economic acceleration. The Fed eased because growth was weakening, not strengthening. That distinction matters, given that earnings come from economic activity. Given current market valuations, if earnings expectations decline, the risk of the market “re-pricing” valuations becomes significant.
While the Fed’s move provides bulls with ammunition, structural imbalances persist, inherently creating market fragility. Liquidity is necessary, but not sufficient, and it sets the stage for performance; however, earnings and guidance will still drive outcomes. If inflation flares again or labor markets weaken too quickly, risk sentiment could reverse fast.
Just because the Fed removed the “brakes,” the risk to investors has not vanished. Yes, stocks will likely benefit into year-end, but the road ahead still requires careful navigation. This is not an all-clear; it is more akin to a reprieve. Markets are forward-looking, and while policy is now a tailwind, it’s still unclear how strong that wind will blow.
The Bond Market Reprices: Fed Back in Play
However, one area that could also benefit from the end of the Fed’s QT is the Treasury market. After more than a year of balance sheet runoff, the central bank is no longer a net seller, which alone changes the supply-demand equation. The Treasury must still issue record volumes of debt, but one of the largest marginal sellers has now stepped aside. That shift eases pressure on the long end of the curve.
The bond market has already been pushing rates lower and bond prices higher over recent weeks, heading into this announcement. As shown, the 20+ Year Treasury Bond ETF (TLT) has broken above both the 50– and 200-day moving averages (DMAs) and triggered a “golden cross,” establishing a bullish trend over the last few months. This is a significantly bullish development after the last few years of downward pressure due to rising inflation and restrictive Fed policies.
(Click on image to enlarge)

With that, the bond market is now pricing in a different regime where policy is no longer restrictive. Real yields are falling, and inflation breakevens remain anchored. That combination improves the total return profile for Treasuries, especially those with intermediate and long durations.
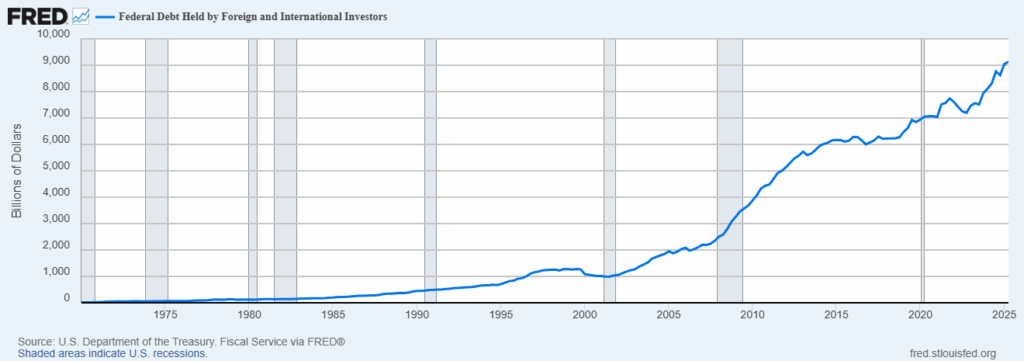
This policy shift also reduces volatility in the rates market. QT was unpredictable, and the monthly roll-off capped reserve balances, increasing stress in repo markets. With the Fed out of the way, supply dynamics become more stable, helping institutional allocators such as pensions, insurers, sovereign funds, etc. to re-engage with longer-dated paper. That too has already been happening as foreign buyers of US Treasuries have surged to a record in recent months.
(Click on image to enlarge)
For investors, this creates a new opportunity in fixed income. Bond prices have policy support for the first time in nearly two years. Income is meaningful, and capital appreciation is back in the conversation. If growth slows or inflation continues to decline, longer-duration Treasuries may outperform.
While the backdrop has improved, it’s not risk-free. However, it is possible to view Treasuries as viable ballast again. With policy support returning and yields still elevated by historical standards, the bond market has shifted from headwind to tailwind. That matters for portfolios built on balance and risk management.
Tactical Investing Strategies for an Accommodative Fed
The Fed’s policy shift—cutting rates and ending QT—marked a clear transition from tightening to easing. Liquidity is stabilizing, rates are falling, and the Fed has removed itself as a seller of Treasuries. These moves are supportive of both equity and bond prices. But supportive does not mean guaranteed. Policy is a tailwind, not a parachute. Investors must adjust their positioning to reflect the changing environment while maintaining discipline.
Here are portfolio tactics to consider:
- Increase exposure to intermediate-duration bonds. With the Fed backstopping liquidity and cutting rates, 5- to 10-year Treasuries offer attractive risk-adjusted returns.
- Tilt equity exposure toward rate-sensitive sectors. Technology, communication services, and discretionary names outperform when financial conditions ease.
- Reduce cash holdings modestly. Holding excess cash made sense when rates were rising. With the Fed now easing, idle capital risks underperform.
- Rebalance fixed income allocation. Add quality credit exposure where spreads remain attractive. Consider investing in investment-grade corporates over high-yield bonds for better risk control.
- Monitor cyclical sectors carefully. Industrials and financials may lag if growth weakens further, despite easier policy.
- Maintain exposure to defensives. Consumer staples and utilities continue to play a role if inflation flares or growth deteriorates unexpectedly.
- Use options or hedges selectively. Despite the supportive policy backdrop, event risk remains. Protecting downside is prudent.
- Watch liquidity metrics. Reserve balances, repo spreads, and Treasury auction coverage ratios will indicate how smoothly the policy shift is being absorbed.
The Fed’s move removed a significant overhang. But outcomes are never guaranteed. Easing policy can delay market stress, not eliminate it. You should position for a more constructive market, but manage risk as if uncertainty remains high—because it does. Use this environment to reset exposures and reallocate with intention.
Trade accordingly.
(Click on image to enlarge)
More By This Author:
Gold Myths Luring Investors Into Risk
Dow Theory: A Concerning Divergence Or Artifact?
Liquidity Concerns Put An End To QT


Comments
Log in or sign up to join the conversation.