
Dow Theory is a market tool developed by Charles Dow in the very early 1900s. Dow also created the Dow Jones Industrial Average. The basic gist of Dow theory is that market trends are confirmed when gains or record highs are established in the broader market indexes, and then confirmed by similar trends and/or record highs in the Dow Jones Transportation Index.
Over 100 years ago, when he proposed the Dow Theory, the US was much more of a manufacturing nation; thus, the health of the shipping and trucking industries was a paramount gauge of the economy. Today, services account for over two-thirds of the economy; thus, shipping is not as important. That said, trucking, an essential component of the transportation industry, helps us appreciate the flow of goods within the US, whether domestically made or imported. Therefore, it can still serve as a good economic gauge.
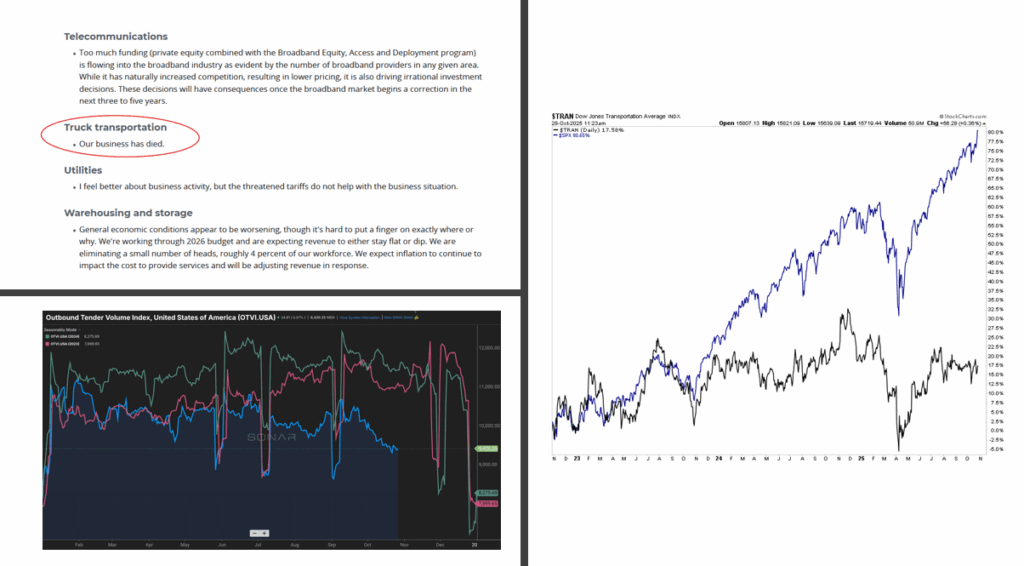
With that, we present two graphs and a comment that elicits Dow Theory and asks whether we should be concerned or if Dow Theory is an artifact of the past.
- The first is a comment from the most recent Dallas Fed Services Survey. While it is only one trucking executive’s opinion, it speaks for itself.
- The graph on the lower left is the Outbound Tender Volume Index (OTVI). The index is a daily measure of the freight volume contracted by shippers for transport. Per its creator, FreightWaves, its data provides a real-time pulse of truckload demand in the freight market. As the graph shows, demand for trucking this year (blue) is much weaker than the prior two years.
- Lastly, the graph on the right shows that the Dow Transportation Index is significantly lagging the broader market. Per Charles Dow, this divergence does not confirm the S&P 500’s record highs.
(Click on image to enlarge)
What To Watch Today
Earnings
(Click on image to enlarge)

Economy
(Click on image to enlarge)

Market Trading Update
Yesterday, we discussed the ongoing breadth problem in the market. Yet, despite that concern, the market continues to find buyers on every dip. For now, corporate profits and earnings remain very supportive of bulls as we head into year-end. As noted by FactSet, corporate profitability is indeed very profitable.
“The blended net profit margin for the S&P 500 for Q3 2025 is 12.8%, which is equal to the previous quarter’s net profit margin, but above the year-ago net profit margin and above the 5-year average. In fact, this quarter marks the 6th consecutive quarter that the S&P 500 is reporting a net profit margin above the 5-year average (12.1%).
At the sector level, four sectors are reporting a year-over-year increase in their net profit margins in Q3 2025 compared to Q3 2024, led by the Financials (19.9% vs. 18.0%) and Utilities (16.7% vs. 14.8%) sectors. On the other hand, six sectors are reporting a year-over-year decrease in their net profit margins in Q3 2025 compared to Q3 2024, led by the Communication Services (13.8 vs. 14.8%), Real Estate (34.3% vs. 35.2%), and Health Care (7.3% vs. 8.2%) sectors.
Seven sectors are reporting net profit margins in Q3 2025 that are above their 5-year averages, led by the Utilities (16.7% vs. 13.6%) sector. On the other hand, four sectors are reporting net profit margins in Q3 2025 that are below their 5-year averages, led by the Health Care (7.3% vs. 9.3%) and Energy (8.0% vs. 9.8%) sectors. Five sectors are reporting a quarter-over-quarter increase in their net profit margins in Q3 2025 compared to Q2 2025, led by the Utilities (16.7% vs. 12.8%) sector. On the other hand, six sectors are reporting a quarter-over-quarter decrease in their net profit margins in Q3 2025 compared to Q2 2025, led by the Communication Services (13.8% vs. 15.3%) sector.
It is interesting to note that analysts believe net profit margins for the S&P 500 will be higher in 2026. As of today, the estimated net profit margins for Q4 2025 through Q2 2026 are 12.8%, 13.4% and 13.7%, respectively.”
Insight/2025/10.2025/10.27.2025_Earnings%20Insight/01-sp500-net-profit-margin-q420-q325.png?width=672&height=384&name=01-sp500-net-profit-margin-q420-q325.png)
It is also notable that coming into the Q3 earnings season, Wall Street estimates were on the conservative side, given the unknowns about the impact of tariffs on US companies. It is now apparent that those concerns were overblown as the “beat rate” for earnings is approaching the highest level since the end of the Pandemic-driven economic shutdown.

With both earnings and profitability coming in above expectations, the bulls continue to find the support needed to justify the current valuation overpayment. How long that will last is unknown, but for now, the risk of the “pain trade higher” into year-end seems plausible.
Trade accordingly.
Meta Disappoints Despite Good News
Meta shares fell by nearly ten percent on what appears to be good news. Revenues beat estimates by 3% and prior guidance from Meta by almost 5%. EPS missed estimates significantly, but it was due to a one-time accounting issue related to a temporary difference between taxable income and income reported on financial statements. There’s no impact on future cash flows. Excluding the accounting earnings impact, earnings beat estimates. Most importantly, to the market, CapEx spending plans were increased for the remainder of 2025 and 2026.
Meta is going all out with its spending to transition from a social media platform to an AI computational platform wrapped into social media. As we share in the quote below from its CEO, Mark Zuckerberg, Meta is intent on being an AI leader.
I think it’s pretty early, but I think we’re seeing the returns in the core business that’s giving us a lot of confidence that we should be investing a lot more. And we want to make sure that we’re not underinvesting.
What we find interesting is that increased CapEx spending plans by other large companies have been met with applause. Is this a buying opportunity for Meta, or is the market starting to worry about overinvestment in AI? To help answer that question, consider that Microsoft is also trading lower after its earnings report, which also discussed increased CapEx spending plans.

Two S&P 500s: One Big Divergence
The S&P 500 index is weighted by market cap. Today, that means the top stocks carry much more weight than the remaining stocks. For instance, the Magnificent Seven account for a third of the daily price changes. While the weighted index is most followed, there is also an equal-weighted index. Comparing the market-cap-weighted and equal-weighted indexes can help us measure market breadth. What we have recently seen is a gross divergence between the two indexes.
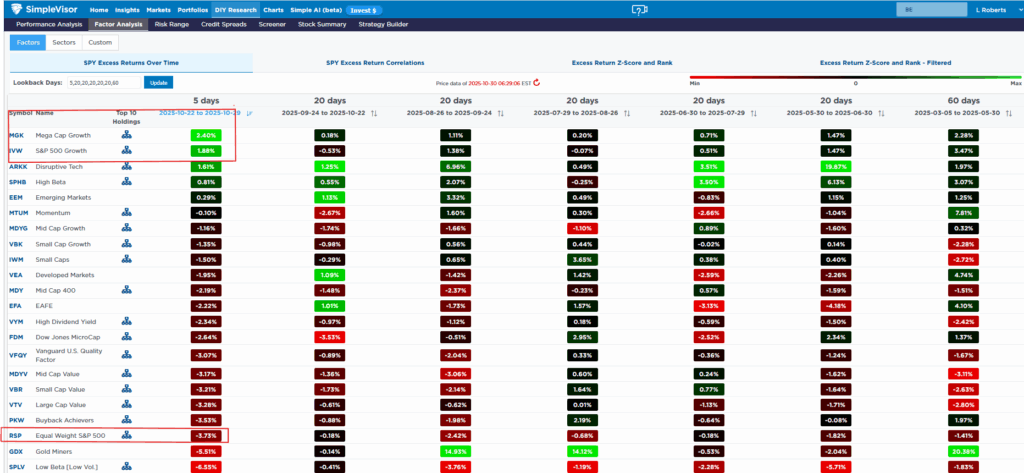
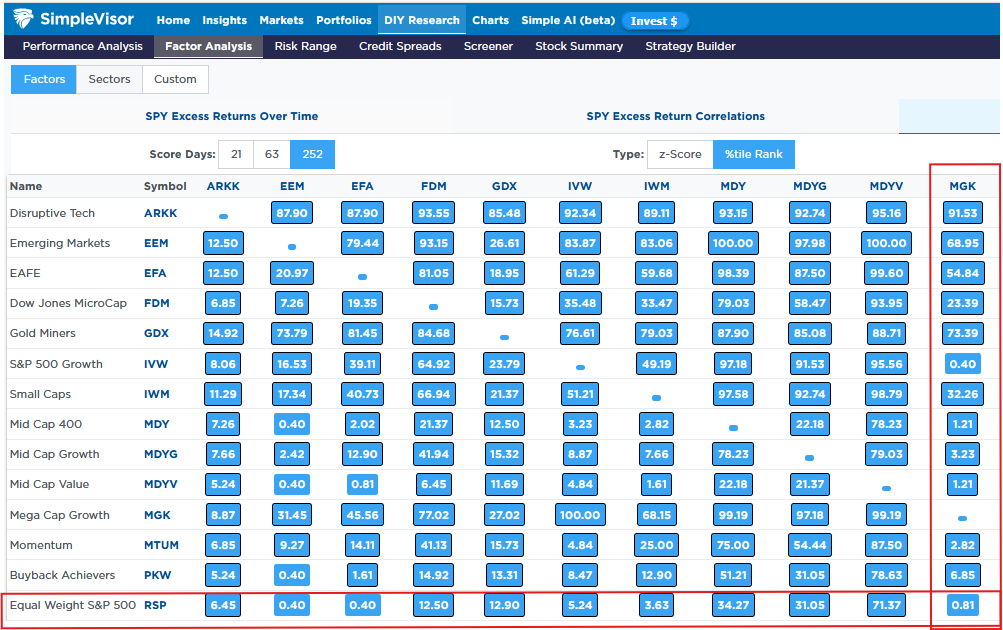
The table below, courtesy of SimpleVisor, shows relative returns as compared to the S&P 500. The two highest excess returns over the last five days are those that are even more heavily weighted in the Magnificent Seven stocks (IVW and MGK) than the market-cap-weighted S&P 500. Towards the bottom, note that the equal-weighted S&P 500 (RSP) has significantly underperformed. The second table, also from SimpleVisor, quantifies the extent of the performance divergence. Per the graphic, over the last 252 trading days (one year), the correlation of excess returns between RSP and mega-cap stocks (MGK) is in the lowest .81 percentile. Another table in SimpleVisor (not shown) indicates that the relationship is nearly two standard deviations from the norm. The Tweet of the Day below provides further context on the gross outperformance of market-cap-weighted indexes versus their equally weighted counterparts.
The takeaway: the market is prime for a rotation from the most prominent companies to the many others being left out. The question is when?
Tweet of the Day

More By This Author:
Liquidity Concerns Put An End To QTRebasing The Dollar: Another Look At The Debasing Narrative
Gold Or Bitcoin: Which Is The ‘Right’ Dollar Hedge?


Comments
Log in or sign up to join the conversation.