
Two weeks ago, Jerome Powell stated, “We may be approaching the end of our balance sheet contraction in the coming months.” In simple terms, as we wrote HERE, he is prepping the market for a quicker end to QT than was previously expected. While Powell was cryptic about why, the answer is obvious: liquidity concerns. As we have noted in the past few weeks, tightness in the overnight funding markets is becoming more prevalent. Powell likely didn’t want to spook the markets by raising concerns about potential liquidity problems.
At yesterday’s FOMC meeting, the Fed cut rates by 25 basis points to a range of 3.75% to 4.00%, as was widely expected. As Powell warned a couple of weeks ago, liquidity concerns pushed the Fed to end QT on December 1. Per the FOMC statement:
The Committee decided to conclude the reduction of its aggregate securities holdings on December 1.
Beyond QT and liquidity concerns, the Fed doesn’t seem overly worried about a slowdown of economic growth. They note that economic activity has been expanding at a moderate pace. Furthermore, the unemployment rate “has edged up” but “remained low.” They state that inflation has risen and remains “somewhat elevated.” There were two dissenting votes. Stephan Miran wanted a 50-bps rate cut, while Jeff Schmid wanted to hold rates steady.
Our initial takeaway is that, barring worsening employment data or lower-than-expected inflation, the Fed may talk the markets down from its 85% probability of a December rate cut. To wit, Powell ended his press conference speech as follows:
An interest rate cut in December is not a foregone conclusion, far from it.

What To Watch Today
Earnings
(Click on image to enlarge)

Economy
(Click on image to enlarge)

Market Trading Update
Yesterday, we touched on the market’s underlying breadth, which has recently worsened as the market has rallied. All of today’s commentary comes from SimpleVisor.com, and we can start with the chart of the number of stocks in the S&P 500 trading above their respective 50, 75, and 150 DMAs. As noted yesterday, that deterioration is very notable given that the index is ringing all-time highs.

Secondly, there has been a significant lag in performance between the Equal Weight and Market Cap-weighted index. Again, this is a breadth issue and confirms that a handful of stocks, the most heavily weighted, are driving the index higher. Over the last 6 months, there has been a 12% gap in performance between the two indices.
(Click on image to enlarge)

We see the same performance gap when examining the absolute and relative performance of the various market factors. MGK (Mega-cap growth) is grossly overbought, while SPLV (Low-Beta, Low Volatility) stocks are grossly oversold. Such suggests that eventually the market is going to rotate, and given the current deviation in performance, that rotation could be quite volatile.
(Click on image to enlarge)

We can culminate our analysis by examining the Risk Range Report, which reveals two crucial factors. The first is that every market and sector, except for Technology and Emerging Markets, underperformed the S&P 500 during the last week. Secondly, Communications (GOOG/META), Technology (MSFT, NVDA), and Discretionary (AMZN/TSLA) are carrying double-digit deviations from their long-term means, with technology the MOST deviated in the S&P 500. Emerging markets (EEM), gold, and gold miners (IAU/GDX) are also grossly extended, although they recently corrected about 50% of their deviation.
(Click on image to enlarge)

The bottom line is that market breadth remains extremely narrow and is getting worse. Such a situation is not usually a good sign for markets as a whole, but so far, this “time has been different.” Retail buyers continue to chase a handful of names, and diversification has been a drag.
However, history suggests some caution. When markets are as complacent as they are now, volatility tends to show up sooner than most expect.
Trade accordingly.
NLY: Deciphering REIT Earnings
Last week’s Commentary summarized how REIT investors view earnings reports differently from most other investors. With that knowledge, we review Wednesday’s earnings report from Annaly Capital Management (NLY).:
NLY reported strong performance driven by mortgage-backed securities (MBS) spread tightening (yields fell more for MBS than UST) and reduced market volatility. Highlights include: GAAP net income of $1.21 per share, earnings available for distribution (EAD) of $0.73 per share (beating consensus of $0.72), and net revenue of $885.6 million. The investment portfolio grew to $122.1 billion, with leverage remaining at 7.1x.
REIT investors look to different data to assess their investments. We share three of those below for NLY:
Economic Return – NLY had an 8.1% economic return, bringing its year-to-date total to 11.5%. This is due to favorable interest rate spreads.
Price to Book Value– Book value per common share rose to $19.25. With the stock trading around $21.06 as of October 28, the price-to-book ratio stands at 1.09, a slight premium to net asset value. MBS yields have fallen since then, so the book value is likely slightly higher than $19.25 today.
Dividend Sustainability– The quarterly $0.70 dividend is well-covered, with earnings available for distribution of $0.73 per share, providing a payout ratio of about 96%. The annualized dividend yield is 13.3%. Per CFO Serena Wolfe:
We are confident in maintaining earnings and dividend coverage, supported by stable swap portfolios and disciplined asset deployment.
Given our outlook for lower yields and a steepening yield curve, we like NLY’s prospects. However, the premium to BV introduces dilution risk to shareholders. Additionally, MBS spreads could widen if QT ends. NLY shares have been stable over the last two years. Given the double-digit dividend yield, investors are not banking on stock gains to supplement total return.
(Click on image to enlarge)

CAPE Valuations: Does Nvidia Overstate Its Ominous Warnings?
Nvidia has a current CAPE ratio of 293, but a more reasonable P/E ratio of 48. Thus, we can reasonably argue that, given the recent surge in Nvidia’s earnings, CAPE is misleading. The same holds to some extent for many of the Magnificent Seven stocks, as we show below.
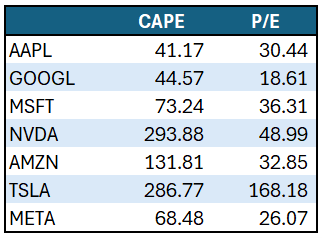
If we strip Nvidia out of the CAPE calculation, the CAPE for the remaining S&P 500 will fall by nearly 3 points. Moreover, if we take all the Magnificent Seven stocks out of the CAPE calculation, CAPE will decline from 41 to 33.
Tweet of the Day

More By This Author:
Rebasing The Dollar: Another Look At The Debasing NarrativeGold Or Bitcoin: Which Is The ‘Right’ Dollar Hedge?
Negative Earnings: Another Speculative Favorite


Comments
Log in or sign up to join the conversation.