
Following futures positions of non-commercials are as of March 18, 2025.
10-year note: Currently net short 881.4k, up 144.3k.
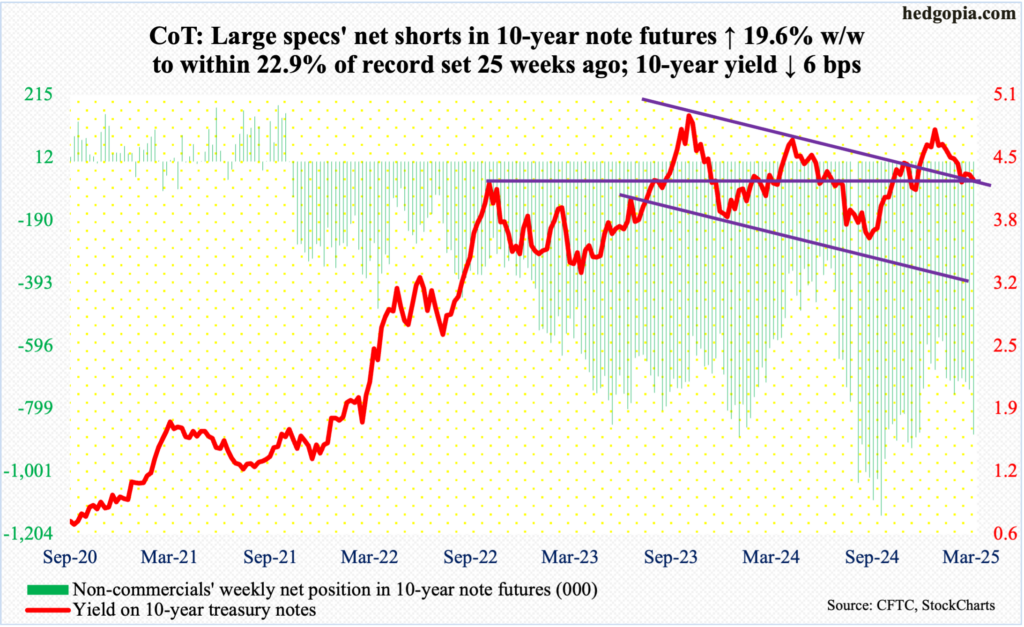
As expected, the FOMC left the fed funds rate steady at a range of 425 basis points to 450 basis points. What was not expected was the rather mixed signal given. The quarterly statement cut the growth rate forecast this year in real GDP from 2.1 percent in December to 1.7 percent, while raising core inflation forecast to grow at 2.8 percent versus the December forecast of 2.5 percent.
In the futures market, traders seem to place more emphasis on the GDP forecast, as they now expect three 25-basis-point cuts this year to a range of 350 basis points to 375 basis points, as opposed to two going into the two-day meeting. That said, there was a time when they were expecting six to seven cuts this year.
At the post-meeting presser, Chair Jerome Powell said a good part of the uptick in inflation projection has to do with tariffs. Forecasts are forecasts. This is even more true now, as Powell himself said the forecasts are “highly uncertain.” Indeed, the uncertainty surrounding the Trump administration’s tariff/fiscal policy is just too big. In this environment, the collective wisdom of markets itself should be viewed with a lot of caution, as possible policy distortion creeps in.
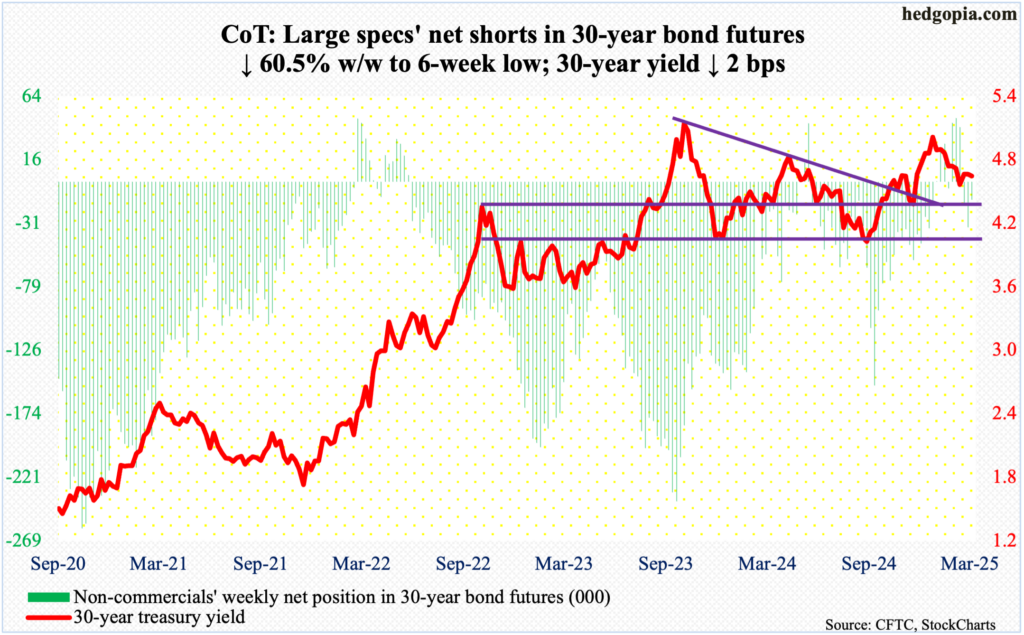
30-year bond: Currently net short 13.5k, down 20.7k.
Major US economic releases for next week are as follows.
The S&P Case-Shiller home price index (January) and new home sales (February) are scheduled for Tuesday.
In December, home prices nationally rose 3.9 percent year-over-year. This was the fastest growth rate in four months.
Sales of new homes tumbled 10.5 percent month-over-month in January to a seasonally adjusted annual rate of 657,000 units – a three-month low.
Durable goods orders (February) will be out Wednesday. Orders for non-defense capital goods ex-aircraft – proxy for business capex plans – increased 0.8 percent m/m in January to $75.1 billion (SAAR). This was a new high.
GDP (4Q24, 3rd estimate) and corporate profits (4Q24) are on schedule for Thursday.
The second estimate showed real GDP grew 2.3 percent during the December quarter. This was a three-quarter low.
During the September quarter, corporate profits with inventory valuation and capital consumption adjustments rose six percent from a year ago to $3.8 trillion (SAAR), slightly lower than the June quarter’s record $3.82 trillion.
Friday brings personal income/spending (February) and the University of Michigan’s consumer sentiment index (March, final).
In the 12 months to January, headline and core PCE (personal consumption expenditures) increased 2.5 percent and 2.6 percent respectively. The two reached four-decade highs of 7.2 percent and 5.6 percent in June and February of 2022.
March’s preliminary reading showed consumer sentiment dropped 6.8 points m/m to 57.9 – a 28-month low. As recently as December, sentiment hit an eight-month high 74.
WTI crude oil: Currently net long 164k, up 9.5k.
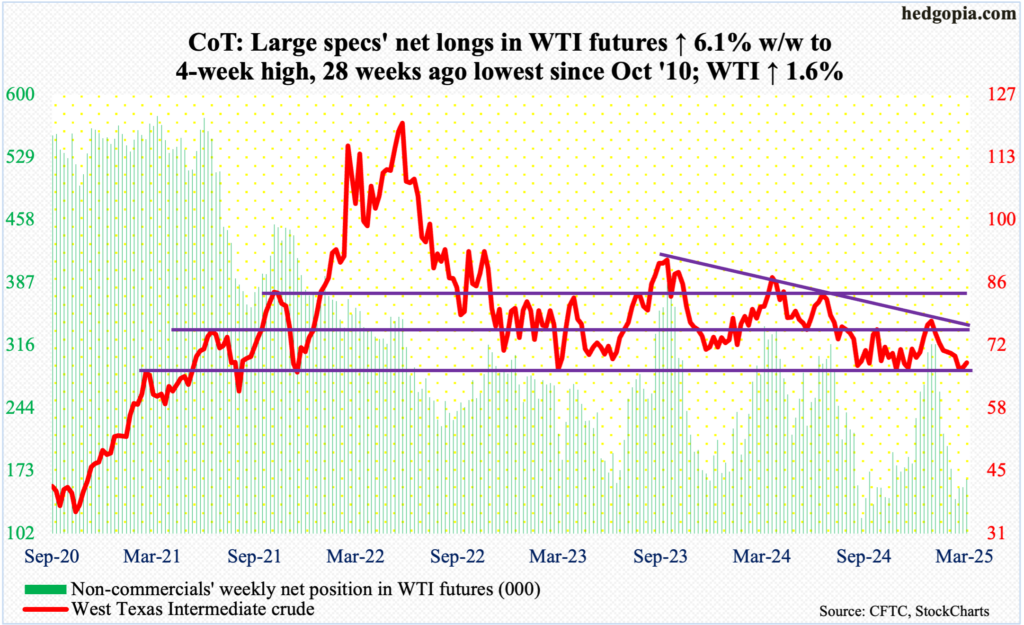
This week’s 1.6-percent rise in West Texas Intermediate crude followed defense of horizontal support at $65-$66 in the prior two weeks and a weekly long-legged doji last week, which preceded eight consecutive weekly declines. Mid-January, it tagged $79.39 and headed lower.
The crude closed this week at $68.28/barrel, with an intraday tag of $66.09 on Wednesday. Support at $65-$66 goes back years and it attracted buying last September as well.
Additional strength is likely in the sessions ahead. Horizontal resistance at $68 was unable to halt oil bulls’ advance. Ahead lies $71-$72, which makes up the lower bound of a months-long range with the upper bound at $81-$82. This range was broken last September. Ideally, bulls would love to go test trendline resistance at $76, which originates in September 2023 when WTI peaked at $95.03.
In the meantime, US crude production in the week to March 14 decreased 2,000 barrels per day week-over-week to 13.573 million b/d; output has come under slight pressure since registering a record 13.631 mb/d in the week to December 6. Crude imports dropped as well, down 85,000 b/d to 5.4 mb/d. As did gasoline and distillate inventory which decreased 527,000 barrels and 2.8 million barrels respectively to 240.6 million barrels and 114.8 million barrels. Crude stocks, however, increased 1.7 million barrels to 437 million barrels. Refinery utilization rose four-tenths of a percentage point to 86.9 percent.
E-mini S&P 500: Currently net long 68.3k, down 12.3k.
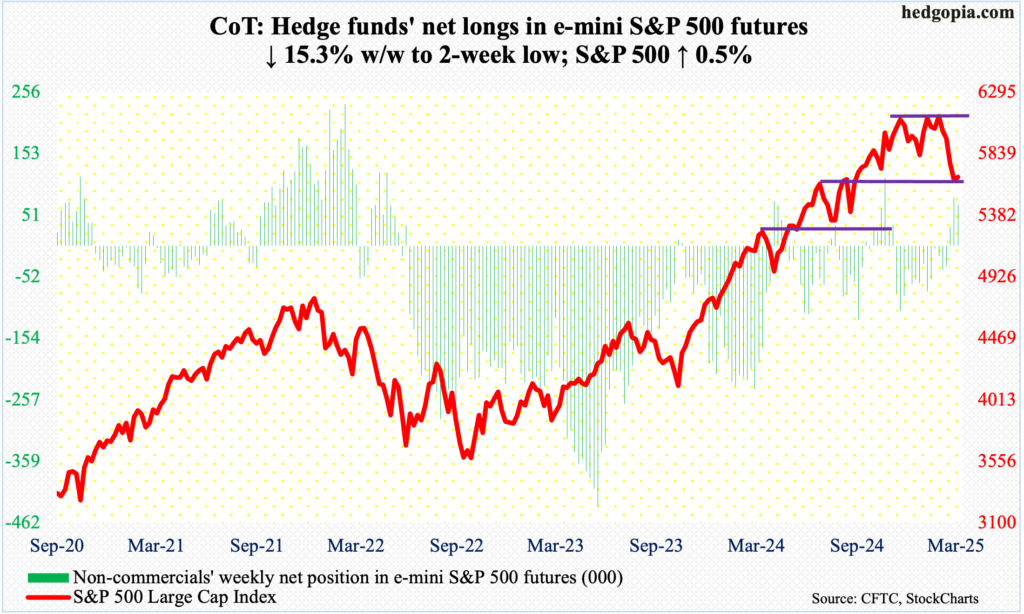
After remaining net short for 14 weeks in a row, non-commercials are now net long for three successive weeks. Holdings were reduced this week, but nothing major. More important is how the cash acted.
Until noon Friday, the S&P 500 was a touch lower for the week. Then, bids started showing up; by close, the large cap index had rallied enough to go up 0.5 percent for the week to 5668. This comes on the heels of four weeks of declines.
Between February 19th when the S&P 500 reached a fresh intraday high of 6147 and March 13th when it bottomed at 5505, the index tumbled 10.5 percent. This low has now gained in significance; should a breach not occur, the path of least resistance is up.
Immediately ahead, the 200-day moving average at 5750 offers resistance. Right around there lies horizontal resistance at 5770s.
Euro: Currently net long 59.4k, up 46.3k.
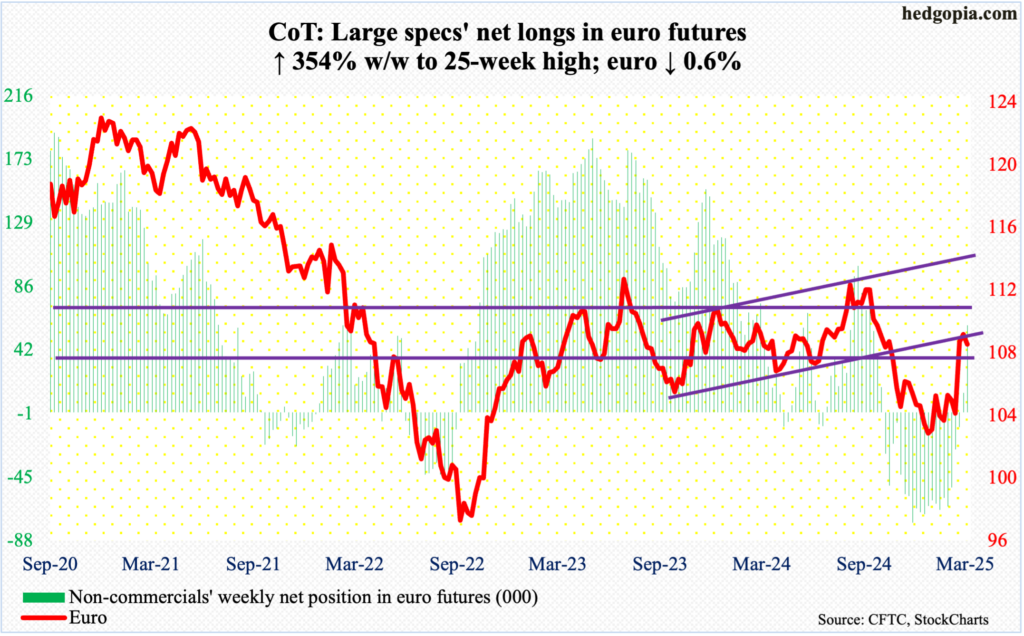
For the second week in a row, euro bulls faced rejection at $1.09s, with this week’s high of $1.0955 following last week’s $1.0947. For the week, it fell 0.6 percent to $1.0815. More weakness probably lies ahead.
Difficulty at $1.09s arose after a decent two-month rally. Earlier, the currency fell sharply starting September 30th last year following rejection at $1.12 for six consecutive weeks. Then, it began to stabilize early this year around $1.02s, which was defended for a whole month.
In due course, resistance-turned-support at $1.05, which goes back at least a decade and which was reclaimed 14 sessions ago, likely gets tested. Before this, the 200-day lies at $1.0729.
Gold: Currently net long 257.9k, up 21.8k.
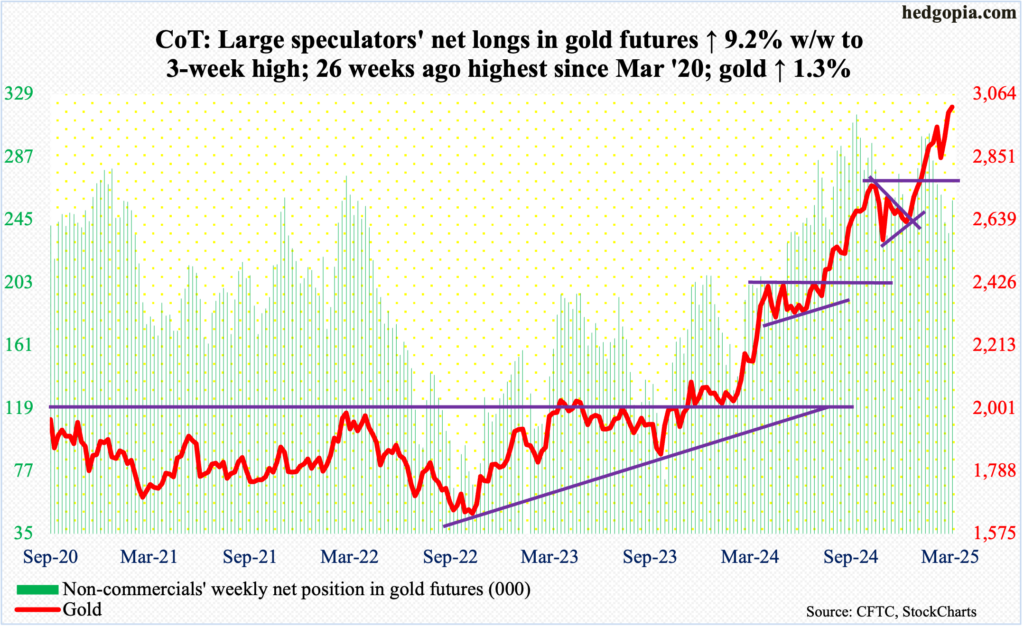
There is no stopping the yellow metal. Gold added another 1.3 percent this week to $3,021/ounce, with Thursday registering a fresh intraday high of $3,057. This was an 11th up week in the last 12. Gold touched $2,608 on December 30th last year.
Not surprisingly, the metal remains overbought. In the event unwinding of this condition begins, what transpires at $2,960s-70s will be telling. Gold struggled at that range for two weeks last month before slightly coming under pressure and then bottoming on February 28th. The resistance was taken care of seven sessions ago.
Nasdaq (mini): Currently net long 23k, up 267.
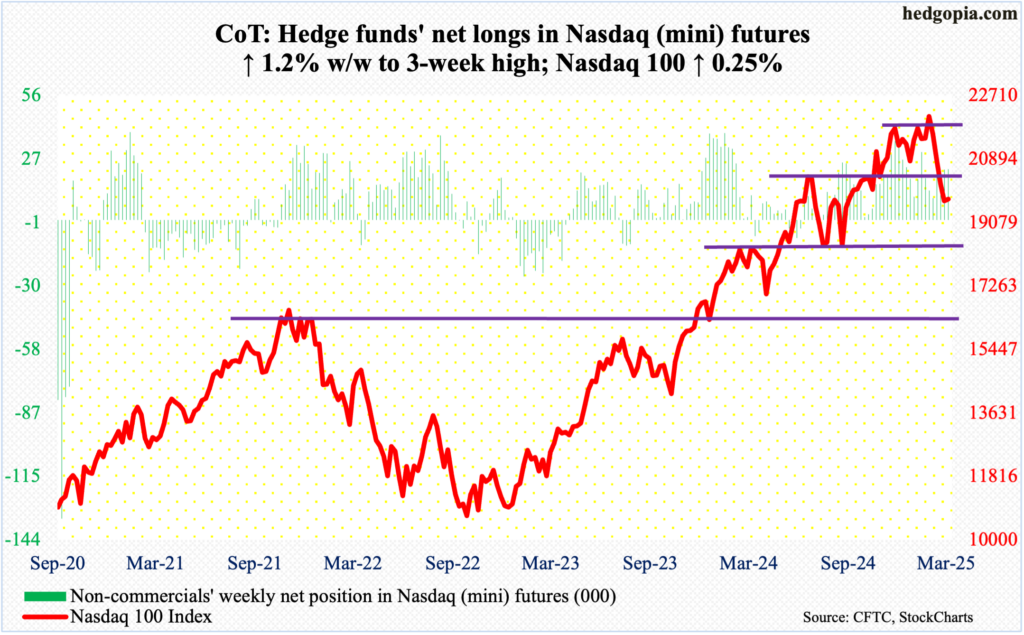
For the second week in a row, the Nasdaq 100 traded in a sideways pattern. Last week, it fell 2.5 percent but recovered from a 5.2-percent decline at one time. This week, the tech-heavy index inched up 0.25 percent to 19754.
Earlier, from the February 18th all-time high of 22223 to the March 13th low of 19153, the Nasdaq 100 dropped 12.8 percent. This week’s gain follows four weekly drops. Importantly, this week’s spinning top comes after last week’s bullish hammer reversal.
Ahead, the 200-day rests at 20293. After that comes important test of horizontal resistance at 20500s.
Russell 2000 mini-index: Currently net short 10.2k, up 5k.
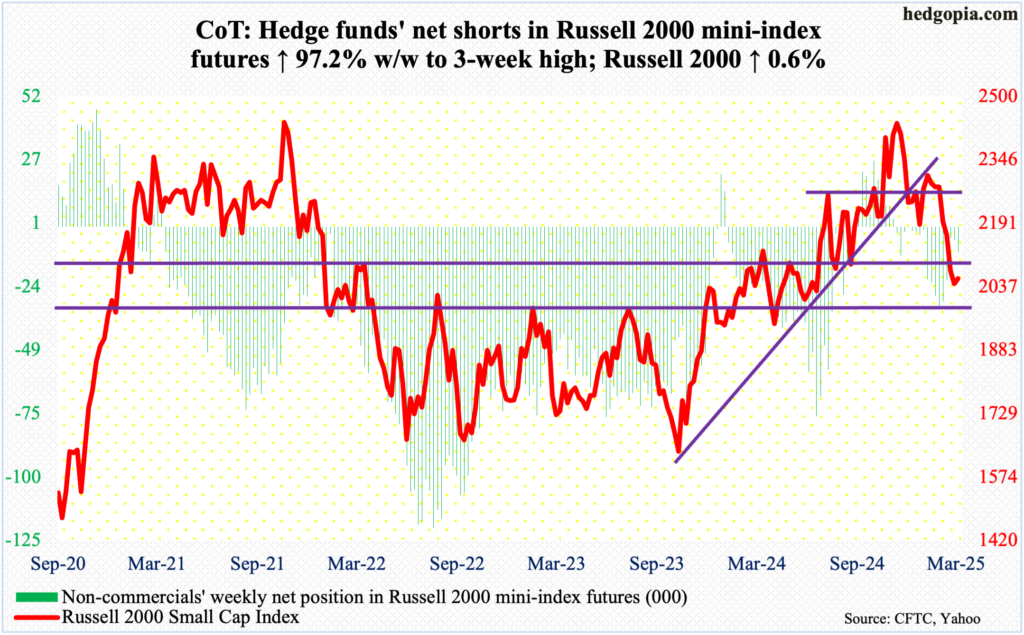
In the first week of this month, breakout retest at 2100, which the Russell 2000 broke out of last July, with a successful retest in September, failed. Subsequently, the small cap index dropped as low as 1985 by the 13th. By then, it was down 19.5 percent from November 25th (last year) when a new all-time high of 2466 scraped past the prior high of 2459 from November 2021.
This week, the Russell 2000 just fell short of testing that breakdown, with Wednesday ticking 2092 and Thursday 2090. In the end, it finished the week up 0.6 percent to 2057. For now, 2100 is the make-or-break for the bulls.
In the meantime, for whatever it is worth, the fast-declining 50-day (2198) has slightly undercut the flattish 200-day (2203). If the trend continues, a death cross will have been completed.
US Dollar Index: Currently net long 7.2k, down 9.6k.
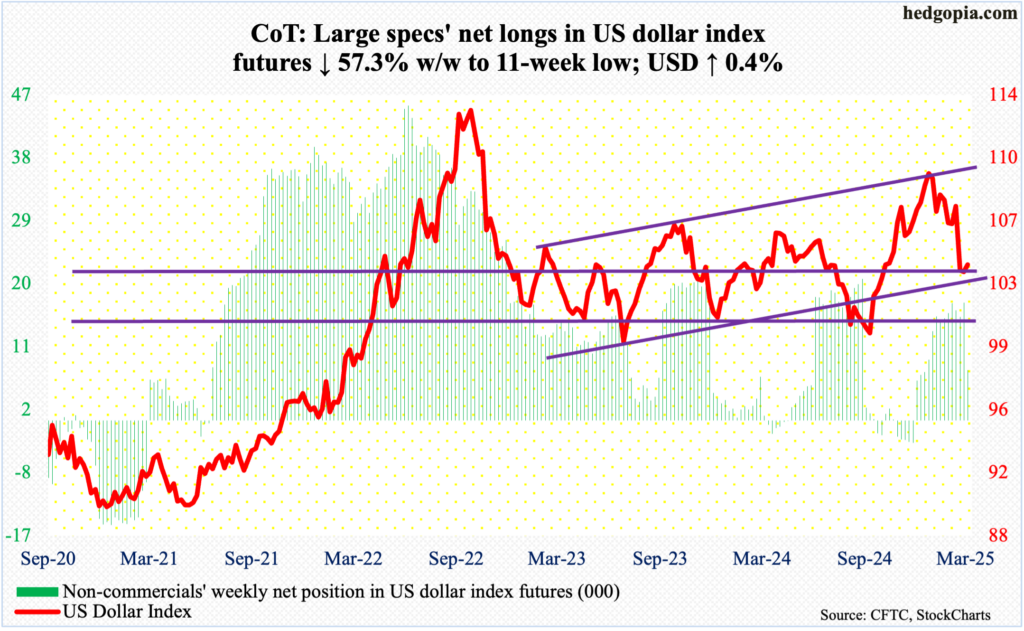
Dollar bulls have managed to defend 103.20s. This week’s low of 103.20 follows last week’s 103.23. This week, the US dollar index rose 0.4 percent to 104.13. Before this, it was down in seven of nine weeks. It hit a wall on January 13th coming under pressure after a two-plus-year intraday high of 110.18 was tagged.
A rally seems imminent. Immediate resistance lies at the 200-day at 104.96.
VIX: Currently net long 6.2k, up 24.1k.
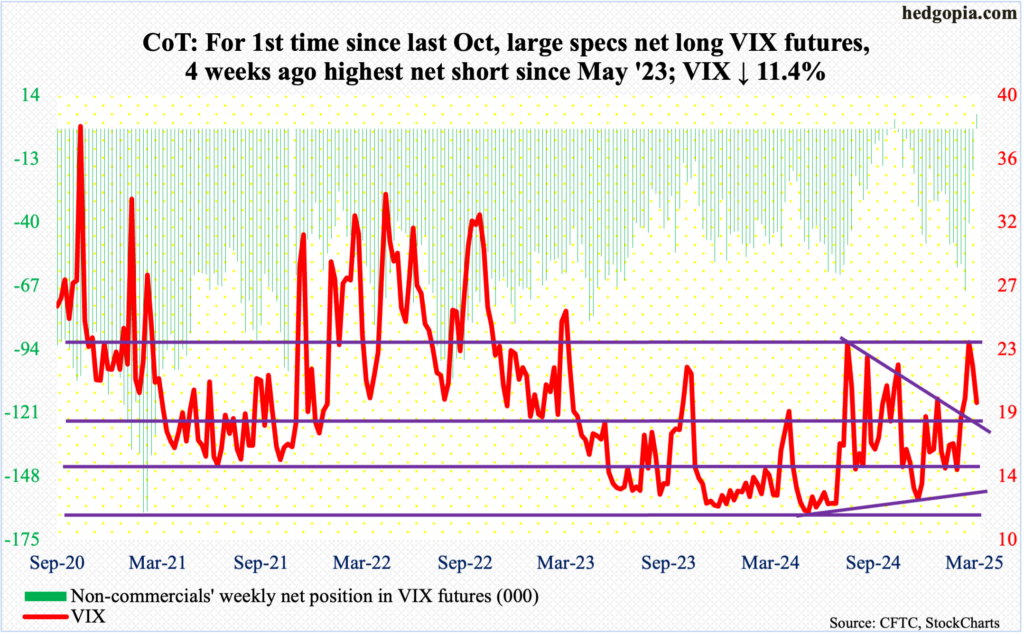
After what looked like a spike reversal last week, VIX gave back 2.49 points this week to 19.28. On Monday and Tuesday last week, it tagged 29.56 and 29.57 respectively before rolling over. On February 14th, the volatility index closed sub-15.
Also, several times in the past, the weekly RSI (53.09) has tended to retreat from around 60. This occurred again, as the metric stopped just south of 62 two weeks ago.
These signs are showing up at a time when non-commercials just went net long VIX futures. Several times in the past, the volatility index has tended to peak once these traders either go net long or get close to doing that. Most recently, they were net long for two weeks through October 22nd (last year), and VIX went from 23.42 on the 31st that month to 12.70 as of December 6th.
Thanks for reading!
More By This Author:
Under Pressure For Several Weeks, Equities Could Be Signaling A Relief Is Imminent
CoT: Who's Buying What, And What It Means
Friday’s Reversal Should Bode Well For Equity Bulls/Volatility Bears N/T


Comments
Log in or sign up to join the conversation.