
CoT: Who's Buying What, And What It Means
Following futures positions of non-commercials are as of March 11, 2025.
10-year note: Currently net short 737.1k, up 25k.
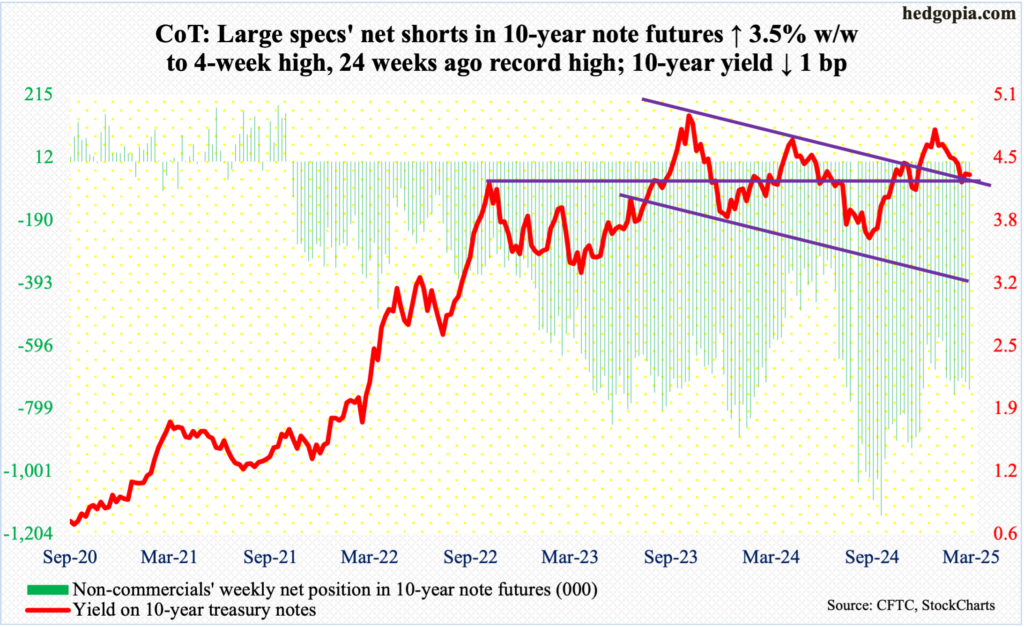
In the futures market, traders are once again betting that there would be at least two 25-basis-point cuts in the fed funds rate by December this year. The benchmark rates are currently between 425 basis points and 450 basis points. Since last September, the Federal Reserve has reduced the rates by 100 basis points over three meetings. The FOMC meets again next week, and they are expected to leave the rates unchanged.
Despite that, it will be an important meeting, as this one is taking place at a time when the economy is showing signs of deceleration amid tons of uncertainty surrounding tariff/fiscal policy of the Donald Trump administration. Markets would want the FOMC to lean dovish, but the policy-setting body likely considers this premature to do so outright. In the end, Chair Jerome Powell may just emphasize their data-dependency commitment.
Thus, it is premature to conclude if the futures traders’ bets on two to three cuts this year will materialize. In recent months, they have been all over the map, with expectations of six to seven cuts at one time to just one just a few weeks ago. With that said, as things stand, the winds increasingly are blowing their way.
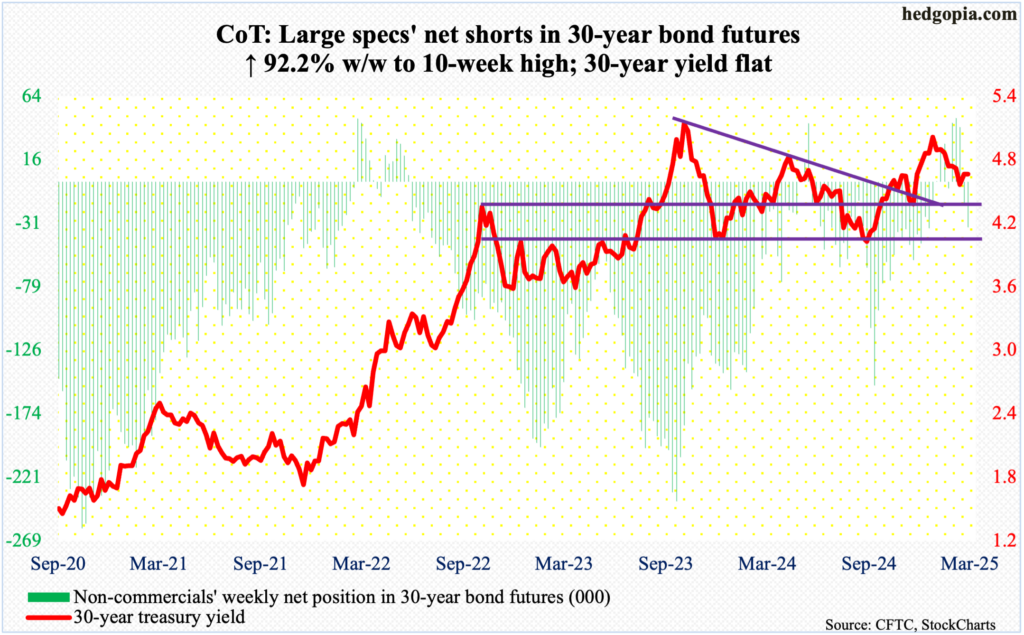
30-year bond: Currently net short 34.2k, up 16.4k.
Major US economic releases for next week are as follows.
Retail sales (February) and the NAHB housing market index (March) are due out Monday.
January retail sales dropped 0.9 percent month-over-month to a seasonally adjusted annual rate of $723.9 billion. December’s $730.3 billion was a record high.
Homebuilder optimism dropped five points m/m in February to a five-month low of 42.
Housing starts (February) and industrial capacity utilization (February) are scheduled for Tuesday.
Starts tumbled 9.8 percent m/m in January to 1.37 million units (SAAR). December’s 1.51 million set a 10-month high.
Capacity utilization in January increased 0.4 percent m/m to 77.8 percent. This was a five-month high.
Thursday brigs existing home sales (February). In January, sales declined 4.9 percent m/m to 4.08 million units (SAAR) – a four-month low.
WTI crude oil: Currently net long 154.5k, up 788.
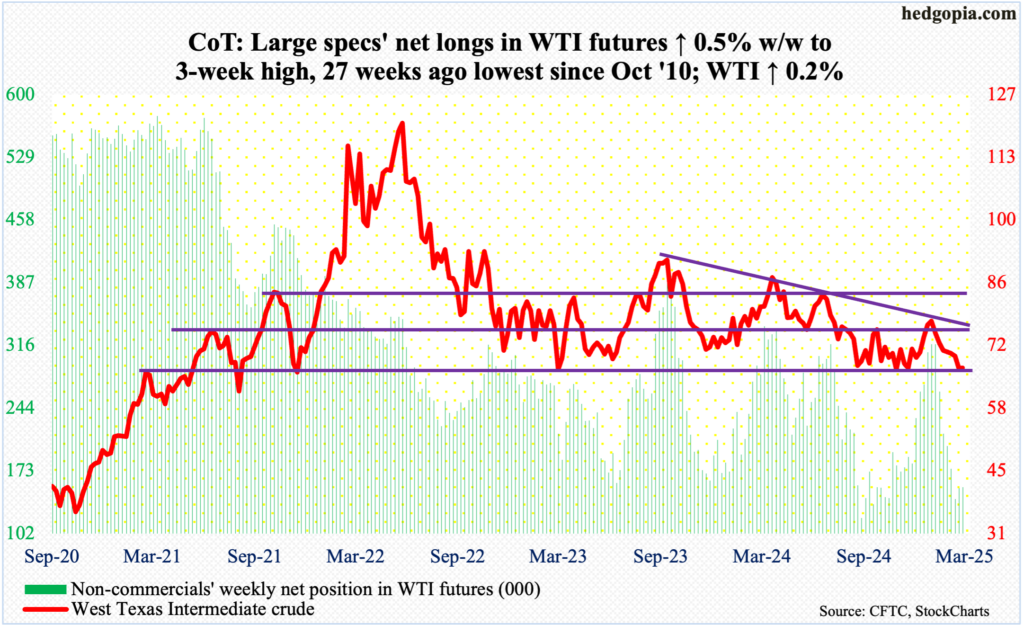
Yet again, horizontal support at $65-$66, which goes back years, drew bids. Tuesday’s intraday low of $65.29 was used by oil bulls as an opportunity to go long. This followed last Wednesday’s intraday low of $65.22. Most recently, $65-$66 also attracted buying last September.
For the week, West Texas Intermediate crude inched up 0.2 percent to $67.18/barrel. This comes after eight consecutive weekly declines. Mid-January, it tagged $79.39 and headed lower. Defense of $65-$66 raises the odds of a relief rally.
Immediately ahead, there is horizontal resistance at $68. This will be then followed by $71-$72, which makes up the lower bound of a months-long range with the upper bound at $81-$82. This range was broken last September.
In the meantime, US crude production in the week to March 7 increased 57,000 barrels per day w/w to 13.575 million b/d; output has come under slight pressure since registering a record 13.631 mb/d in the week to December 6th. Crude imports dropped 343,000 b/d to 5.5 mb/d. As did gasoline and distillate inventory which decreased 5.7 million barrels and 1.6 million barrels respectively to 241.1 million barrels and 117.6 million barrels. Crude stocks, however, increased 1.4 million barrels to 435.2 million barrels. Refinery utilization rose six-tenths of a percentage point to 86.5 percent.
E-mini S&P 500: Currently net long 80.6k, up 48.5k.
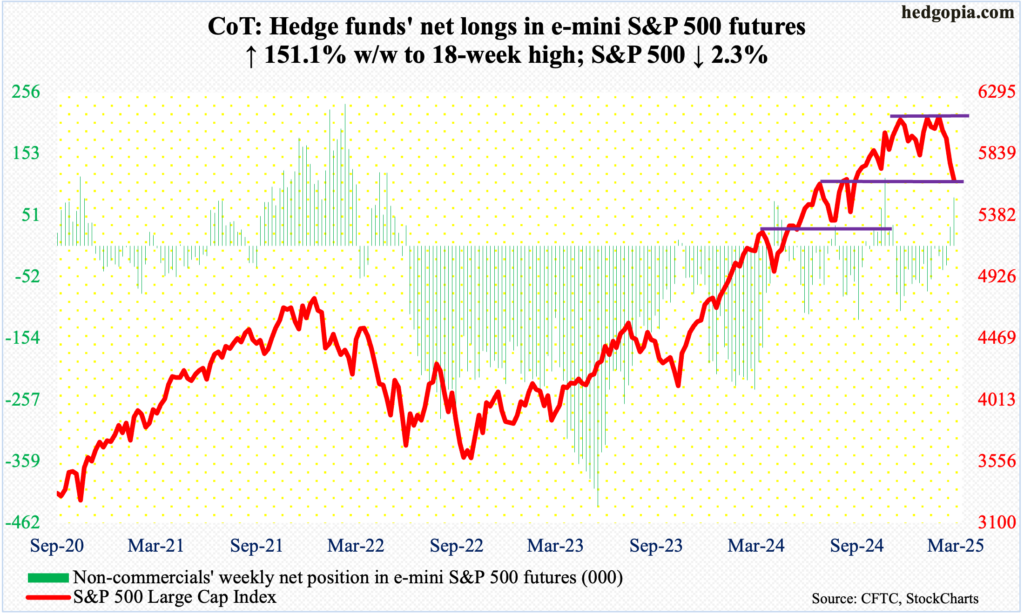
Last week, non-commercials switched to net long after remaining net short for 14 weeks in a row. This week, they showed more aggression, taking holdings to 80,613 contracts, versus net shorts of 39,966 as of February 18th. These traders are likely to do well on this trade.
Between February 19th when the S&P 500 reached a fresh intraday high of 6147 and this Thursday’s low of 5505, the large cap index sank 10.5 percent. Friday’s 2.1-percent rally helped recoup some of these losses, but the week still ended down 2.3 percent to 5639. This was the fourth weekly drop in a row.
In the end, Friday’s reversal helped form a potentially bullish weekly hammer. The daily in particular remains grossly oversold, with the RSI just beginning to rise from an oversold sub-30 level.
Horizontal resistance at 5660s is just a stone’s throw away. After this comes the 200-day at 5740, with the average still rising, albeit slightly. Right around there lies horizontal resistance 5770s, which is the one to watch.
Euro: Currently net long 13.1k, up 23.2k.
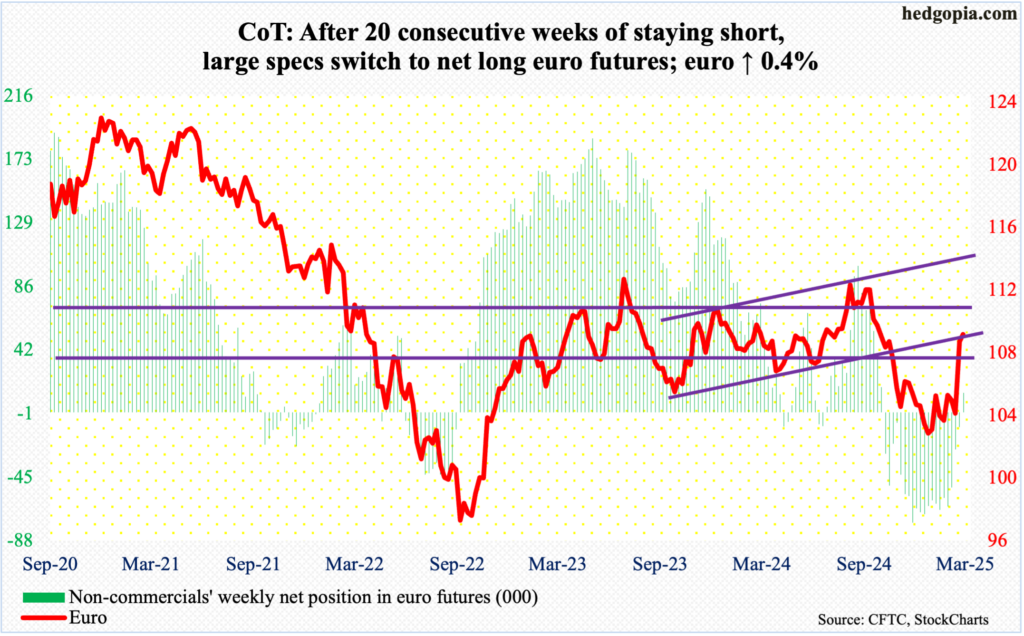
Non-commercials just went net long. This comes after 20 consecutive weeks of staying net short. They made the switch after the euro surged 4.4 percent last week. Momentum continued this week, as the currency added another 0.4 percent to $1.0879, but at the same time euro bulls were unable to hang on to Tuesday’s high of $1.0947, helping form a weekly spinning top.
The daily is extended. Last year, the euro fell sharply starting September 30th after facing rejection at $1.12 for six consecutive weeks. It then started to stabilize early this year around $1.02s, which was defended for a whole month. Thus, the currency has come a long way year-to-date, with momentum building this month. Horizontal resistance at $1.05, which goes back at least a decade, was reclaimed nine sessions ago.
In the event the currency begins to digest its recent gains, the 200-day lies at $1.0727.
Gold: Currently net long 236.1k, down 7.2k.
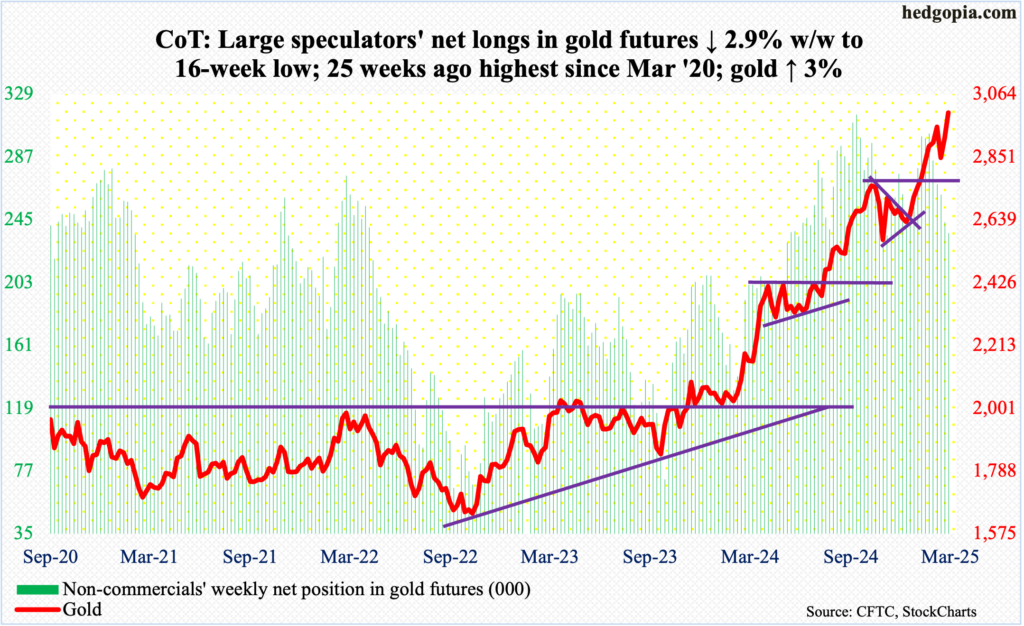
Gold bugs forced another breakout on Thursday. The metal struggled at $2,960s-70s for two weeks before coming under pressure a tad. This Thursday, gold broke out of this hurdle to cross $3,000 intraday. Come Friday, in a long-legged doji session, it printed a new intraday high of $3,017 before closing at $3,001/ounce. For the week, the yellow metal added three percent. Since ticking $2,608 on December 30th, this was the 10th up week in 11.
In the sessions ahead, what transpires at $2,960s-70s will be telling.
Nasdaq (mini): Currently net long 22.7k, up 963.
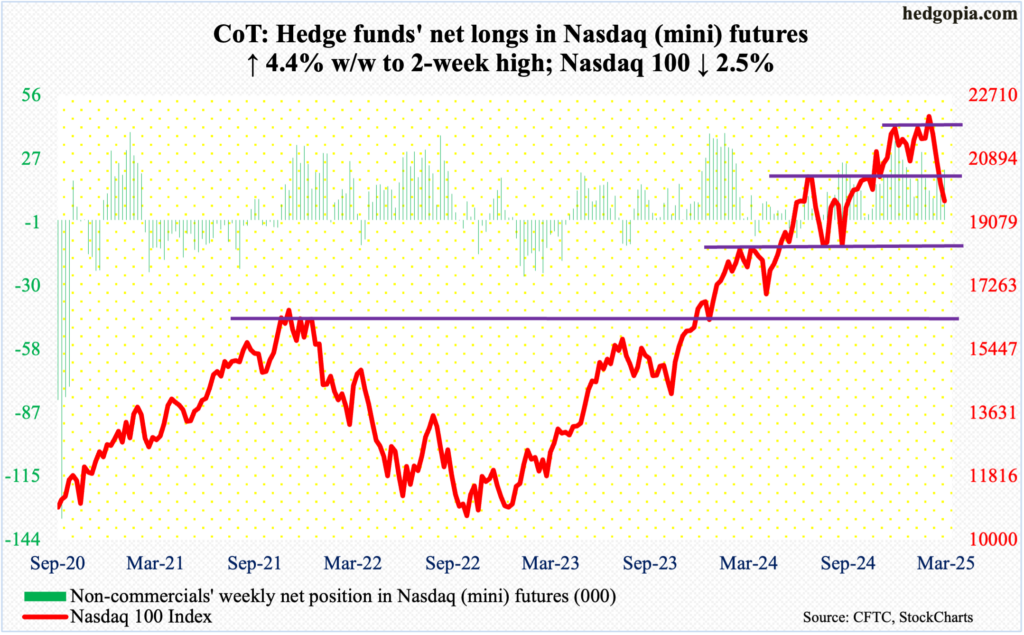
From the February 18th all-time high of 22223 to this Thursday’s low of 19153, the Nasdaq 100 quickly dropped 12.8 percent. Along the way, the tech-heavy index breached several support levels, including the 50- and 200-day.
Going into this week, the index was already down for three straight weeks. Tech bulls were not able to stop the bleeding, as the week ended down 2.5 percent, but they did succeed in cutting the magnitude of the loss. At Thursday’s low, the Nasdaq 100 was down 5.2 percent.
Consequently, a potentially bullish hammer reversal has occurred on the weekly. The 200-day lies at 20267. After that comes horizontal resistance at 20500s, which was breached seven sessions ago.
Russell 2000 mini-index: Currently net short 5.2k, up 602.
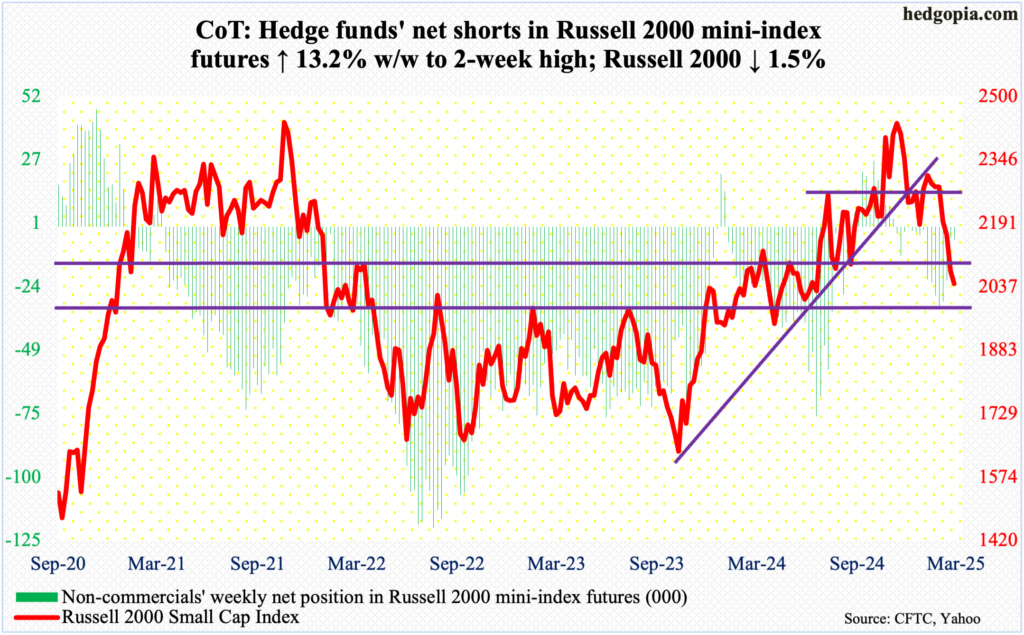
The Russell 2000’s 1.5-percent decline this week compares well versus the two large-cap indices above. Under pressure since November 25th (last year) when a new all-time high of 2466 barely scraped past the prior high of 2459 from November 2021, the small cap index gave back 19.5 percent through Thursday’s low of 1985. Some of these losses were won back as the index rallied 2.5 percent on Friday to 2044.
Earlier, breakout retest at 2100, which the index broke out of last July, with a successful retest in September, failed last week. If risk-on prevails in the sessions to come – likely – reclaiming 2100 will open the door toward the 200-day at 2203, with the 50-day at 2216.
US Dollar Index: Currently net long 16.8k, up 2.1k.
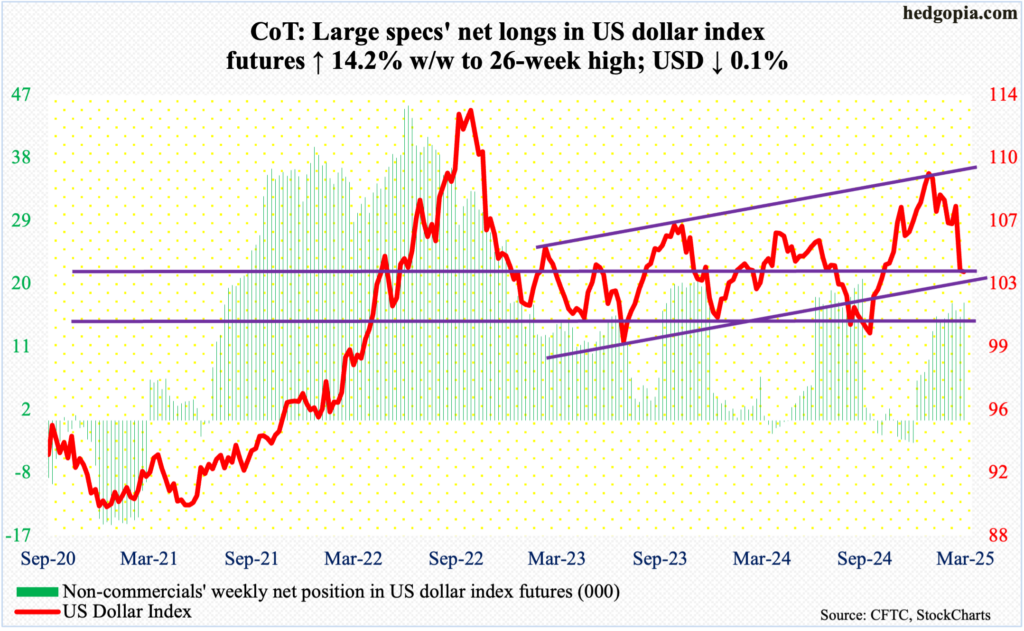
The US dollar index, down 0.1 percent this week to 103.7, is now down in seven of nine weeks. This comes after ample signs that a two-plus-year intraday high of 110.18 hit on January 13th had the potential to be a major high.
Last week, the index broke down 3.6 percent. This pushed several daily indicators into gross oversold territory. A relief may be in the cards in the sessions ahead. Immediately ahead rests the 200-day at 104.99.
VIX: Currently net short 17.9k, down 22.3k.
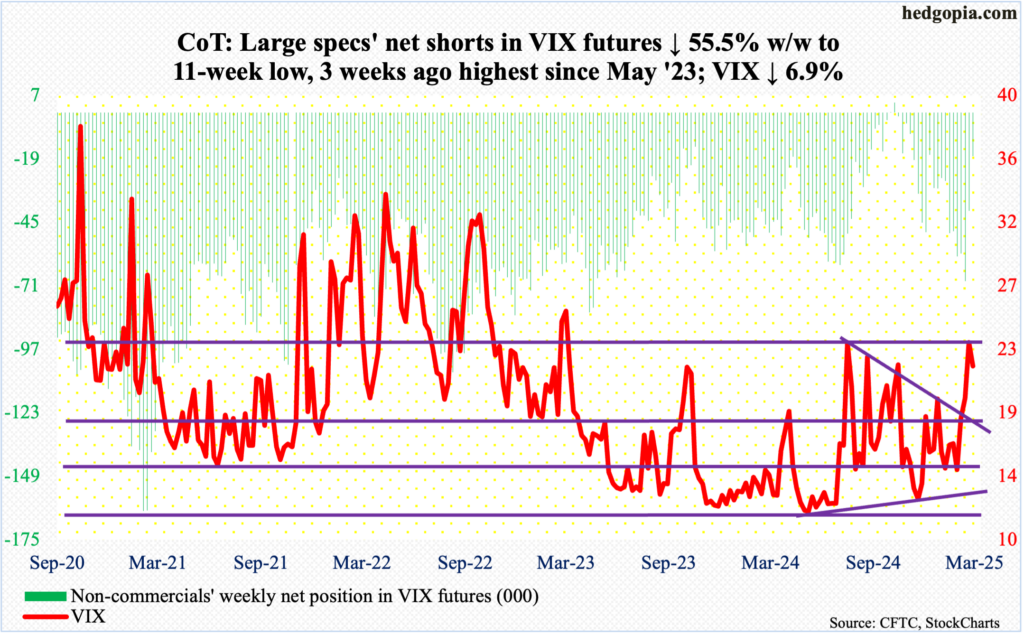
VIX rallied as high as 29.56 on Monday and 29.57 on Tuesday, but only to close out the week at 21.77, up 1.60 points. In the end, the weekly formed a candle with a long upper wick – for a potential spike reversal.
Concurrently, non-commercials cut their net shorts from 69,103 contracts three weeks ago to this week’s 17,882. Several times in the past, the volatility index has tended to peak once these traders either go net long or get close to doing that. Most recently, they were net long for two successive weeks through October 22nd (last year), and VIX went from 23.42 on the 31st that month to 12.70 as of December 6th.
Last but not the least, several times in the past, the weekly RSI (57.88) has tended to retreat from around 60. This is occurring again, as the metric was stopped just south of 62 last week.
Thanks for reading!
More By This Author:
Friday’s Reversal Should Bode Well For Equity Bulls/Volatility Bears N/T
CoT: Peek Into Future Thru Futures, Hedge Fund Positioning
Amidst Elevated Valuations, Macro/Policy Uncertainty, Relief Rally Possible In Equities


