
CoT: Peek Into Future Thru Futures, Hedge Fund Positioning
Following futures positions of non-commercials are as of March 4, 2025.
10-year note: Currently net short 712k, up 12.2k.
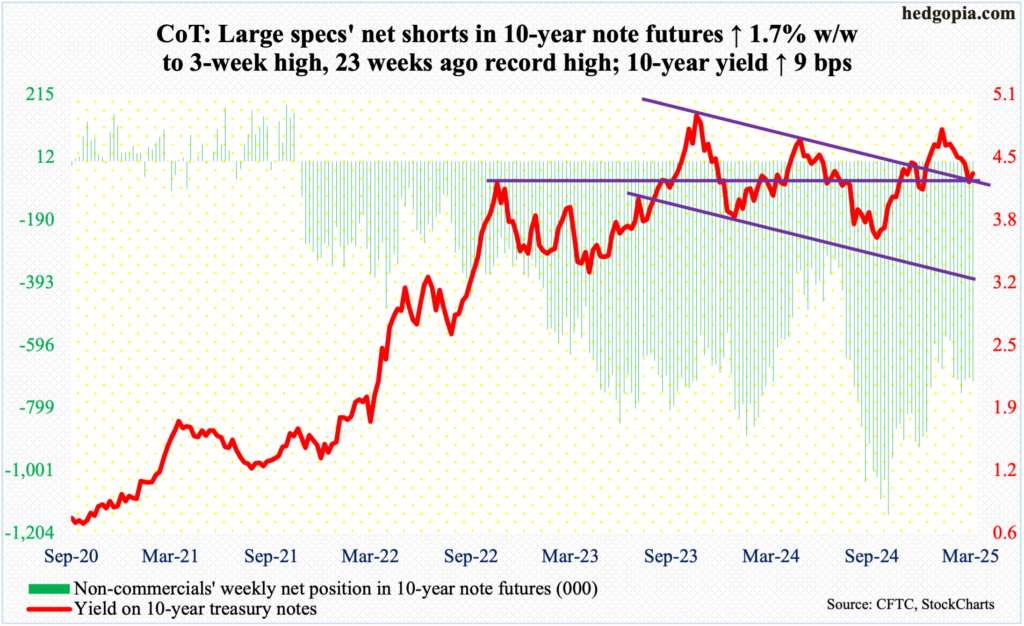
Horizontal support at 4.2s-4.3s goes back years. Last week, the 10-year treasury yield closed at 4.23 percent. It was a make-or-break. Rates had been under pressure since hitting 4.81 percent on January 14th.
This week, the 10-year began with a down Monday, followed by more downward pressure on Tuesday with a session low of 4.11 percent. The breach of 4.2s-4.3s likely led to short-covering by bond shorts such as non-commercials, and this may have caused yields to drop more, which, as it turned out, proved fleeting.
Tuesday’s intraday drop to 4.11 percent was embraced by the shorts. By Friday, the 10-year was yielding 4.32 percent – back above the 200-day moving average at 4.23 percent. Once again, the 4.2s-4.3s level is in play. Continued strength in the sessions ahead is the path of least resistance. The 50-day at 4.52 percent should act like a magnet for now.
30-year bond: Currently net short 17.8k, up 58.7k.

Major US economic releases for next week are as follows.
The NFIB optimism index (February) and job openings (JOLTs, January) are on schedule for Tuesday.
Small-business job openings remained unchanged month-over-month at 35 in January. Readings have been rangebound between 34 and 36 for five months.
Non-farm job openings declined 556,000 m/m in December to 7.6 million. Last September’s 7.4 million was the lowest since January 2021. The all-time high of 12.2 million was hit in March 2022.
Wednesday brings the consumer price index (February). In the 12 months to January, headline and core CPI increased three percent and 3.3 percent respectively. Last September and July, they reached a 43- and 39-month low of 2.4 percent and 3.2 percent, in that order. They hit four-decade highs of 9.1 percent and 6.6 percent in June and September of 2022.
The producer price index (February) is scheduled for Thursday. Headline and core wholesale prices in January rose 3.5 percent and 3.4 percent from a year ago respectively.
The University of Michigan’s consumer sentiment index (March, preliminary) will be published Friday. Consumer sentiment in February tumbled seven points m/m to 64.7 – a 15-month low. Last March’s 79.4 was the highest since July 2021.
WTI crude oil: Currently net long 153.7k, up 12.5k.
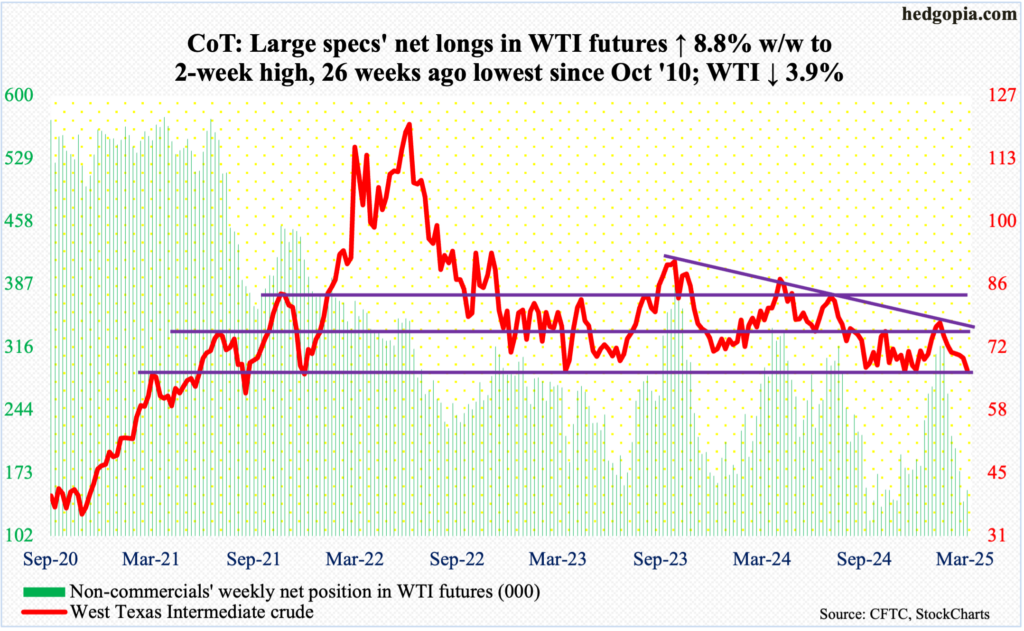
Last September, West Texas Intermediate crude ticked $65.27 and bottomed; it had come under pressure after tagging $84.52 in July. Horizontal support at $65-$66 goes back years. After defense of this support in September, the crude then rallied to $78.46 in October and $79.39 in January. Since that weekly shooting star high, it has dropped for seven weeks in a row.
This week, the crude gave back 3.9 percent to $67.04/barrel, with Wednesday’s intraday low of $65.22. Once again, oil bulls stepped up in defense of $65-$66. A rally is likely. Immediately ahead, there is horizontal resistance at $68. This will be followed by $71-$72, which makes up the lower bound of a months-long range with the upper bound at $81-$82. This range was broken last September.
In the meantime, US crude production in the week to February 28 increased 6,000 barrels per day w/w to 13.508 million b/d; output has come under slight pressure since registering a record 13.631 mb/d in the week to December 6. Crude imports dropped 106,000 b/d to 5.8 mb/d. As did gasoline and distillate inventory which decreased 1.4 million barrels and 1.3 million barrels respectively to 246.8 million barrels and 119.2 million barrels. Crude stocks, however, increased 3.6 million barrels to 433.8 million barrels. Refinery utilization fell six-tenths of a percentage point to 85.9 percent.
E-mini S&P 500: Currently net long 32.1k, up 64.9k.

Non-commercials just switched to net long after remaining net short for 14 weeks in a row. They are likely to do well on this switch – at least near term.
Having suffered two down weeks, bulls tried to take control early on as the S&P 500 began the week on a firm footing (more on this here), but Monday’s initial strength was repelled at the 50-day (now 5982), reversing the session deeply in the red. Downward momentum continued for the rest of the week, finishing the week lower 3.1 percent to 5770.
Friday’s price action, however, should give the bulls hope; within the first two hours of trading, the large cap index dropped to 5666 – breaching the 200-day at 5733 and losing 7.8 percent from the record print of 6147 posted on February 19th. In the end, Friday ended up, reclaiming the 200-day.
The daily is grossly oversold. The S&P 500 ended the week right at 5770s resistance. Once this yields, there is horizontal resistance at 5870s, followed by the 50-day at 5982.
Euro: Currently net short 10.1k, down 15.3k.

Horizontal resistance at $1.05, which goes back at least a decade, was hit in five of the last six weeks, with no signs of yielding. This hurdle finally gave way on Tuesday, releasing tons of suppressed strength. By Friday, the euro rallied 4.4 percent for the week to $1.0833 – past the 200-day at $1.0727.
Last year, the currency fell sharply starting September 30th after facing rejection at $1.12 for six consecutive weeks. It then started to stabilize early this year around $1.02s, which was defended for a whole month.
Before euro bulls could go after $1.12, they are likely to face resistance just north of $1.09. The daily has now been pushed into overbought territory.
Gold: Currently net long 243.3k, down 18.4k.

Last week, after rallying for eight weeks in a row – since it ticked $2,608 on December 30th – gold dropped 3.6 percent. This week, the uptrend continued, as the metal added 2.3 percent to $2,914/ounce, which is well under the all-time high of $2,974 from the 24th last month. Sellers showed up at the highs as gold bugs struggled at $2,960s-70s for several sessions.
For now, gold could go either way – toward its record high or toward $2,800, which it broke out of on January 30th.
Nasdaq (mini): Currently net long 21.8k, down 4k.

For the first time since August 5th last year when stocks bottomed, the Nasdaq 100 breached the 200-day on Thursday. Tech bulls’ attempt to reclaim the average did not quite pan out on Friday, ending at 20201, with the average at 20247. Nevertheless, they are likely to reclaim the average in the sessions to come.
Through Friday’s intraday low of 19737, the Nasdaq 100 dropped 11.2 percent from the 19th last month when it reached a fresh all-time high of 22223. This week, the index shed 3.3 percent – its third straight down week.
There is crucial lateral resistance at 20500s. The downward-sloping 50-day lies at 21340.
Russell 2000 mini-index: Currently net short 4.6k, down 16.8k.

The Russell 2000 tumbled four percent this week. It had already been under pressure since November 25th when a new all-time high of 2466 barely scraped past the prior high of 2459 from November 2021. In recent weeks, the small cap index has gotten its share of selling amidst risk-off mentality in the markets.
This week, the Russell 2000 dropped all the way to 2034 on Friday before recovering to end the session/week at 2075. Breakout retest at 2100, which the index broke out of last July with a successful retest in September, failed this week. Thus, this is the one to watch for now. Reclaiming the level will open the door toward the 200-day at 2204, with the 50-day at 2239.
US Dollar Index: Currently net long 14.7k, down 994.

The US dollar index broke down this week, down 3.6 percent to 103.78. This comes after signs that a two-plus-year intraday high of 110.18 hit on January 13th had the potential to be a major high.
This Wednesday, after four months of staying above the average, the 200-day (105) was breached. The index dropped in all five sessions this week. The daily is oversold, with the RSI ending Friday at 27.84, raising odds of stability near term.
VIX: Currently net short 40.2k, down 28.9k.

The weekly RSI (61.18) has reached the mid-point of 50 and 70. Several times in the past, VIX’s rally attempts have been cut short around here. This likely occurs again.
The volatility index rallied as high as 26.56 on Friday, closing at 23.37, up 3.74 points for the week. This was the third positive week in a row.
Since September last year, 23 – or thereabouts – has posed difficulty for volatility bulls, and this should continue to be the case for now.
Thanks for reading!
More By This Author:
Amidst Elevated Valuations, Macro/Policy Uncertainty, Relief Rally Possible In Equities
Peek Into The Future Thru Futures, Hedge Fund Positions - March 2
Fri’s Big Selloff Appears Before NVDA’s Earnings Results Due Wed


