
Under Pressure For Several Weeks, Equities Could Be Signaling A Relief Is Imminent
Equities have been under pressure the last several weeks. Investor sentiment has taken a beating. Amidst this came signs last Friday that a relief could be in the making.
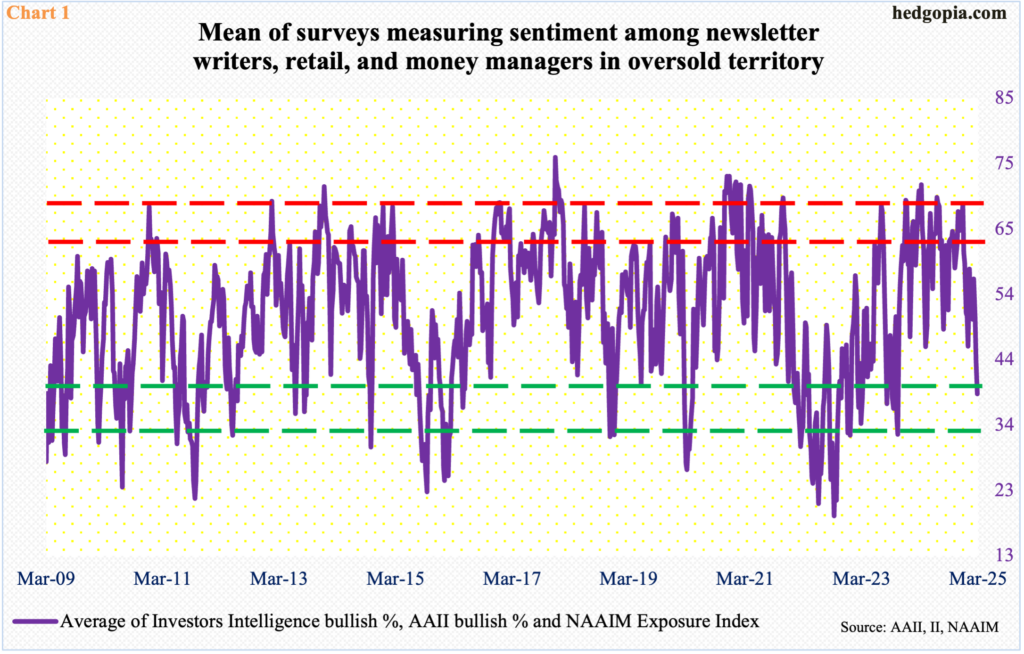
With the major equity indices under selling pressure for at least four weeks now, investor sentiment has taken a real hit. In the week to last Tuesday, Investors Intelligence bulls tumbled 9.1 percentage points week-over-week to 27.6 percent. In the week to last Wednesday, the NAAIM Exposure Index dropped 6.2 points w/w to 68.8, while American Association of Individual Investors bulls in the week to last Thursday declined two-tenths of a percentage point w/w to 19.1 percent. The three surveys respectively measure sentiment among newsletter writers, money managers, and retail investors. Last week’s readings represent a big drop from the recent highs.
Investors Intelligence bulls hit 62.9 percent in the week to December 3rd last year. This was the highest reading since last July and one of the five consecutive readings of 60-plus. The NAAIM Exposure Index printed 99.2 in the week to December 11th last year and 91.5 in the week to February 19th this year. And AAII bulls hit 48.3 percent in the week to December 5th and 41 percent in the week to January 30th.
Chart 1 combines the three surveys and takes out an average. A reading of 38.5 last week was the lowest since October 2023 and is low enough to drop into oversold territory (Chart 1).
For sentiment to hit this low, from last month’s all-time highs through last Thursday’s lows, the Nasdaq 100 tumbled 12.8 percent and the S&P 500 10.5 percent. From last November’s record through last Thursday’s low, the Russell 2000 in fact sank 19.5 percent.
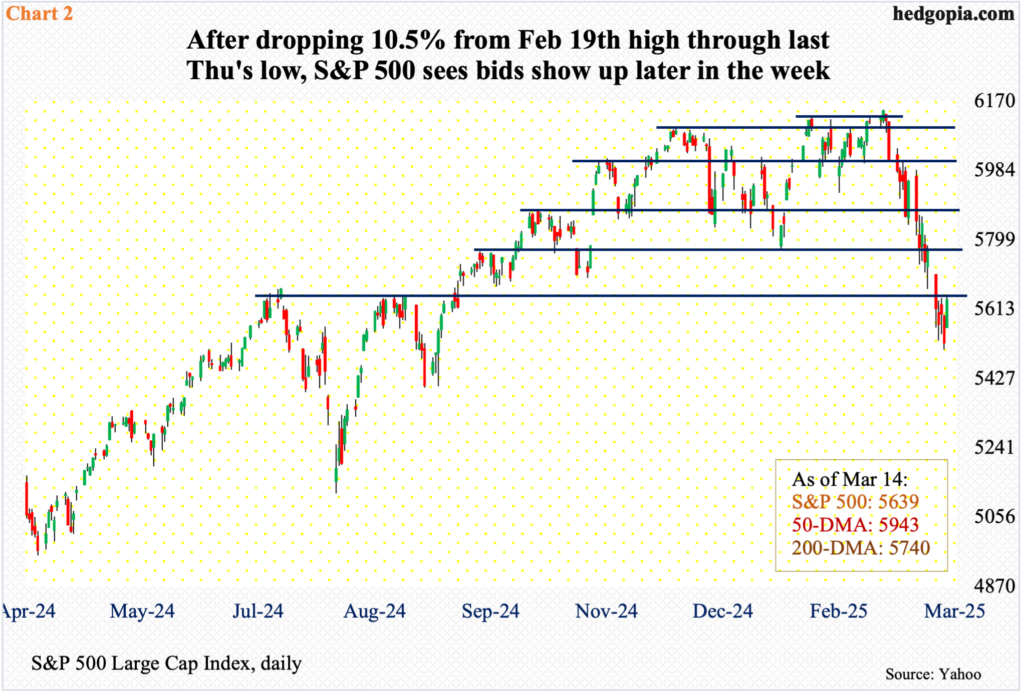
This has pushed these indices into gross oversold territory – the daily particularly. Amidst this came signs last Friday that a relief was due. Through Thursday’s intraday low of 5505, the S&P 500 was down 4.6 percent for the week. Friday’s 2.1-percent jump helped recoup some of these losses, as the week ended down 2.3 percent to 5639. This was the fourth weekly drop in a row.
In the process, a potentially bullish hammer reversal formed on the weekly. Last week’s close occurred just under support-turned-resistance at 5660s. This is the first hurdle the bulls will now need to take care of. Once this is done, they can then aim at the 200-day moving average at 5740, followed by horizontal resistance 5770s (Chart 2).
Help could come from volatility suppression.
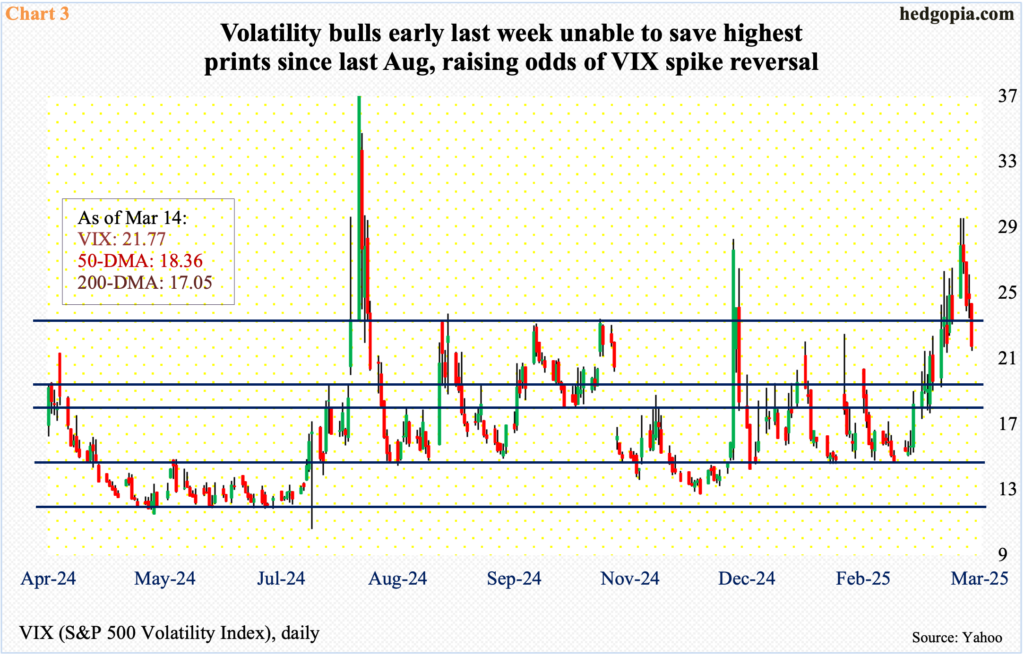
VIX was sub-15 a month ago. On both Monday and Tuesday last week, the volatility index peaked just south of 30 – 29.56 and 29.57 respectively (Chart 3). Volatility bulls, however, were unable to cling on to those highs. By Friday, it closed at 21.77, up 1.60 points for the week. When it was all said and done, the weekly formed a candle with a long upper wick – for a potential spike reversal.
Several times in the past, VIX has tended to spike, but only to then reverse with equal power. This could be one of those times – at least in the near term.
Further, on several occasions in the past, the weekly RSI (57.88) has tended to retreat from around 60. VIX’s rally last week stopped just south of 62 and is turning lower.
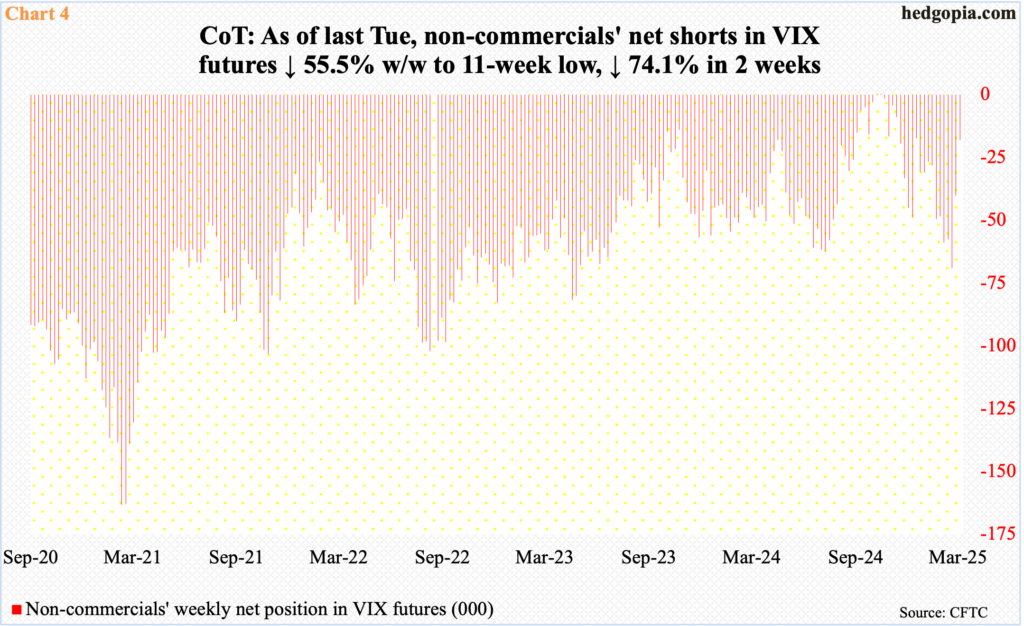
In the futures market, in the meantime, non-commercials have been actively cutting net shorts in VIX futures. Three weeks ago, in the week to February 25th, they were net short 69,103 contracts. As of March 11th last week, this was down to 17,882 (Chart 4). This is potentially important.
Time and again in the past, VIX has shown a tendency to peak once these traders either go net long or get close to doing that. Most recently, they were net long for a couple of weeks through October 22nd (last year), even as VIX went from 23.42 on the 31st that month to 12.70 as of December 6th.
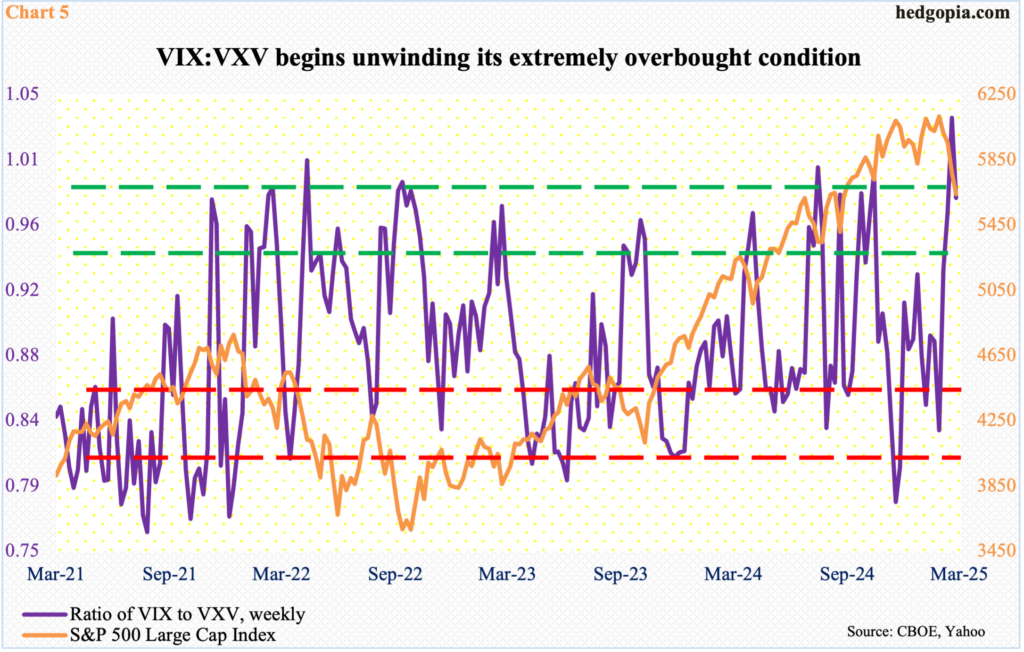
Concurrently, the ratio of VIX to VXV turned lower last week to 0.982. In the prior week, it closed at 1.035, which was the highest reading since October 2020. Readings above one are rare, as they are way above the overbought level identified in Chart 5. Unwinding of this condition results in VIX dropping more than VXV.
VIX measures market’s expectation of 30-day volatility on the S&P 500. VXV does the same, except it goes out to three months. During a risk-off investing environment, as has been the case in recent weeks, demand for VIX-derived securities is higher than VXV. The opposite is true when sentiment turns to risk-on.
In a likely scenario in which the ratio continues to unwind its current extended condition, the resultant drop in VIX should buoy stocks – duration and magnitude notwithstanding.
More By This Author:
CoT: Who's Buying What, And What It MeansFriday’s Reversal Should Bode Well For Equity Bulls/Volatility Bears N/T
CoT: Peek Into Future Thru Futures, Hedge Fund Positioning


