
Following futures positions of non-commercials are as of April 4, 2023.
10-year note: Currently net short 621k, up 149.5k.
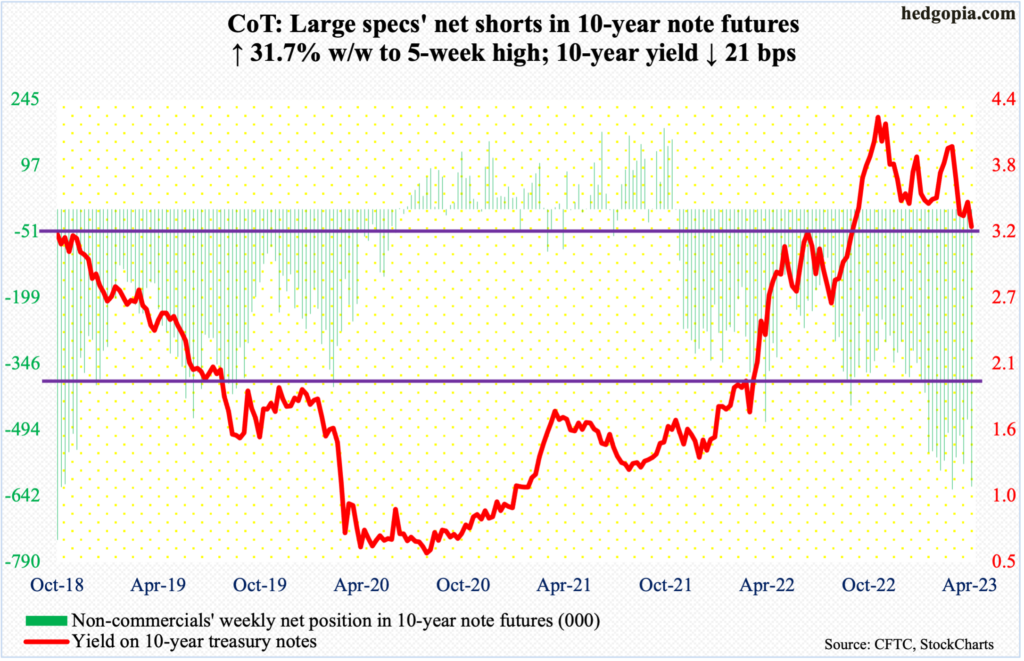
The FOMC minutes for the March 21-22 meeting come out on Wednesday. The fed funds rate was raised by 25 basis points to a range of 475 basis points to 500 basis points in that meeting. In March last year, the benchmark rates were languishing between zero and 25 basis points; rates were left there far too long, and this probably helped sow the seeds of inflation.
Also on Wednesday, March’s CPI will be published. The trend in both headline and core CPI has been down since they both peaked last year but inflation remains elevated, which is what the Federal Reserve is squarely focused on currently. The central bank has a dual mandate of maximum employment and price stability.
The job market is doing just fine, as the unemployment rate of 3.5 percent in March indicates. There are some early signs of a coming crack in the job market (more on this here), but the nearly-five-percentage-point hike in the past year is yet to filter through to the economy in its entirety. Given the persistent price pressure, the Fed wants to (1) hike a little bit more, and (2) keep the rates at higher plateau for longer. Markets disagree on the latter point.
In the futures market, after March’s better-than-expected jobs numbers on Friday, the probability of a 25-basis-point raise in May (2-3) to 500 basis points to 525 basis points rose to 71 percent; this is about where the FOMC dot plot expects the tightening cycle to end before the Fed pauses. Where the two differ is in the rates outlook. Futures traders are pricing in the fed funds rate to end 2023 between 425 basis points and 450 basis points. Several FOMC members, including Chair Jerome Powell, in contrast, expect no rate cuts this year.
In the meantime, several OPEC+ members’ planned cuts in crude output may well have thrown the inflation-focused Fed a curve ball. When it is all said and done, markets in all probability are misreading the Fed’s resolve to bring inflation under control.
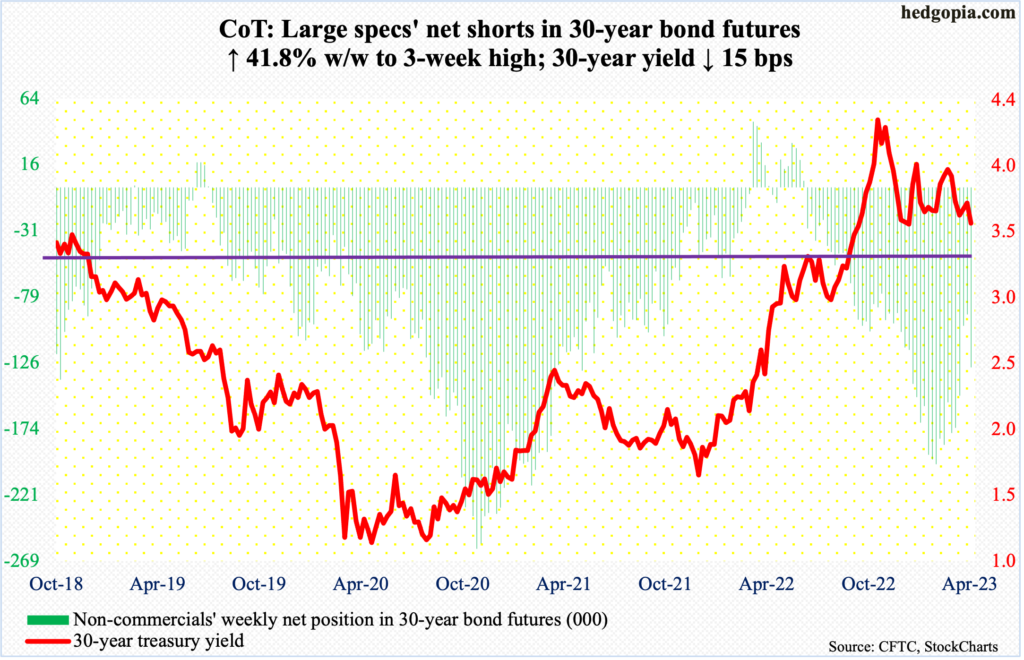
30-year bond: Currently net short 129.6k, up 38.2k.
Major economic releases for next week are as follows.
The NFIB Optimism Index is due out on Tuesday (March). In February, small-business optimism inched up six-tenths of a point month-over-month to 90.9 – a three-month high.
The Consumer Price Index (CPI) will be published on Wednesday (March). In the 12 months to February, headline and core CPI increased six percent and 5.5 percent. They respectively peaked last year at 9.1 percent and 6.6 percent in June and September, in that order. Since their respective peaks, the y/y growth rate has fallen in each month.
The Producer Price Index (PPI) is on tap for Thursday (March). Headline and core PPI rose 4.6 percent and 4.4 percent year-over-year in February.
Friday brings retail sales (March), industrial production (March) and the University of Michigan’s consumer sentiment index (April, preliminary).
February retail sales decreased 0.4 percent from January’s record $700.7 billion.
Capacity utilization in February declined 0.2 percent m/m to 79.1 percent. The cycle high of 80.8 percent was hit last September.
Consumer sentiment tumbled five points m/m in March to 62 – a three-month low.
WTI crude oil: Currently net long 266.3k, up 37.7k.
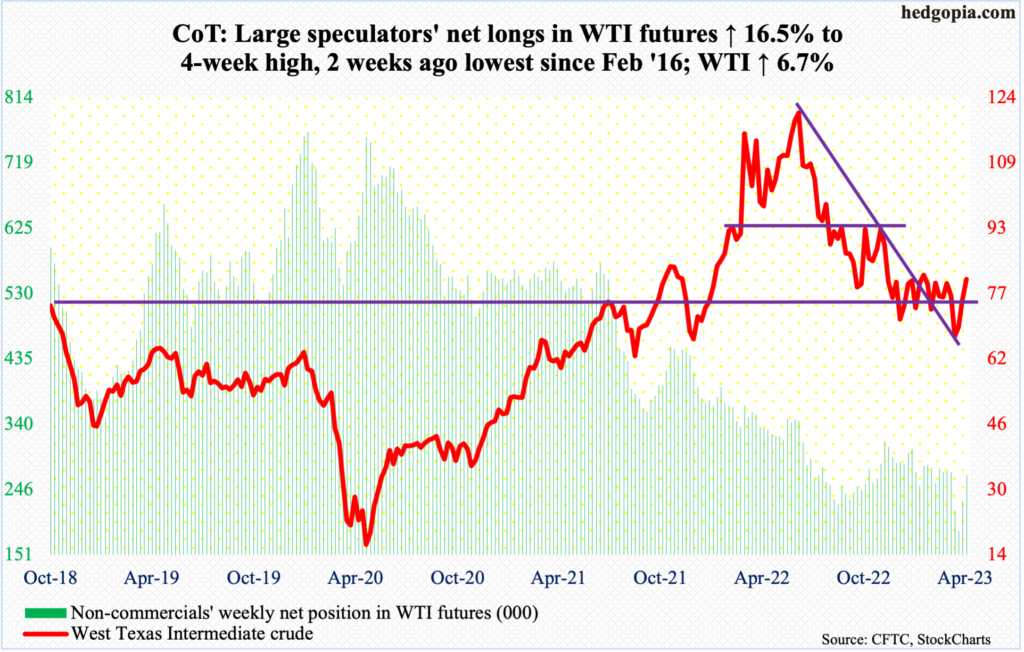
WTI shot up 6.7 percent this week to $80.70/barrel. From the March 20 intraday low of $64.36, it is now up 25.4 percent. This was preceded by a 50.7-percent tumble from the March 2022 high of $130.50.
It was probably this one-year drop in the price that eight OPEC+ producers, including Saudi Arabia, Kuwait, and the United Arab Emirates, announced Sunday that they plan to cut crude production by a combined 1.16 million barrels per day until the end of the year. These are organized voluntary cuts, not a part of formal OPEC+ policy. In addition, Russia wants to cut 500,000 b/d from February output levels until the end of 2023. At the end of 2022, OPEC+ already agreed to cut output by two mb/d until the end of this year.
Reacting to Sunday’s announcement, WTI gapped up Monday to form a daily spinning top. It then tagged $81.81 on Tuesday but only to close at $80.71, once again forming a spinning top. These candles were followed by what looks like a hanging man on Wednesday and a spinning top on Thursday.
A month ago, the crude fell out of a nearly four-month range between $71-$72 and $81-$82. This week’s rally has WTI testing the upper end, attracting offers at the highs. A breakout will be significant but right here and now the daily is extended.
In the meantime, as per the EIA, US crude production in the week to March 31 was unchanged week-over-week at 12.2 mb/d. Crude imports jumped 1.8 mb/d to 7.1 mb/d. Stocks of crude, gasoline, and distillates all dropped – by 3.7 million barrels, 4.1 million barrels and 3.6 million barrels to respectively 470 million barrels, 222.6 million barrels and 113.1 million barrels. Refinery utilization decreased seven-tenths of a percentage point to 89.6 percent.
E-mini S&P 500: Currently net short 321.5k, up 96.8k.
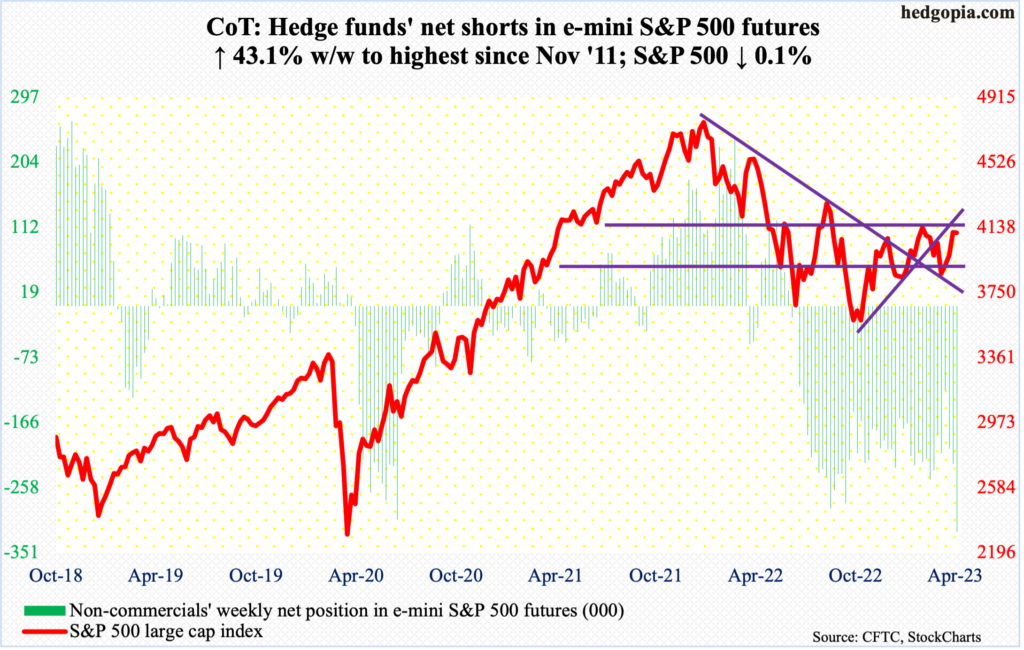
The 6.4-percent rally in the S&P 500 in the prior three weeks lured more onto the bullish bandwagon, as the Investors Intelligence bullish percent in the week to Tuesday jumped 7.8 percentage points week-over-week to 48.6 percent. The large cap index, nevertheless, inched lower 0.1 percent for the week. The bulls were not putting their money where their mouth is.
In the week to Wednesday, US-based equity funds bled another $8.5 billion. This was the seventh weekly outflows in eight, for cumulative withdrawals of $56.2 billion (courtesy of Lipper). Concurrently, SPY (SPDR S&P 500 ETF), VOO (Vanguard S&P 500 ETF) and IVV (iShares Core S&P 500 ETF) witnessed redemptions of $4.7 billion in the week to Wednesday, following outflows of $2 billion in the prior week (courtesy of ETF.com).
The latest bullish reading of 48.6 percent matched the count in the week to February 7; bears were 25.7 percent then, versus 25 percent now. Back then, the large cap index peaked on the 2nd at 4195, and by March 13 had given back 9.2 percent.
This time, too, the S&P 500 is vulnerable. Non-commercials aggressively added to their short positions. At some point, this is likely to help the longs as these traders cover, but right here and now, the odds probably favor the shorts.
The daily is grossly oversold, and the index (4105) is struggling at crucial resistance at 4100. On Tuesday, it ticked 4133 intraday before weakening; at that high, the index was up 0.6 percent for the week, but bears showed up at the underside of the broken rising trendline from last October when the S&P 500 bottomed at 3492.
Euro: Currently net long 143.4k, down 1.6k.
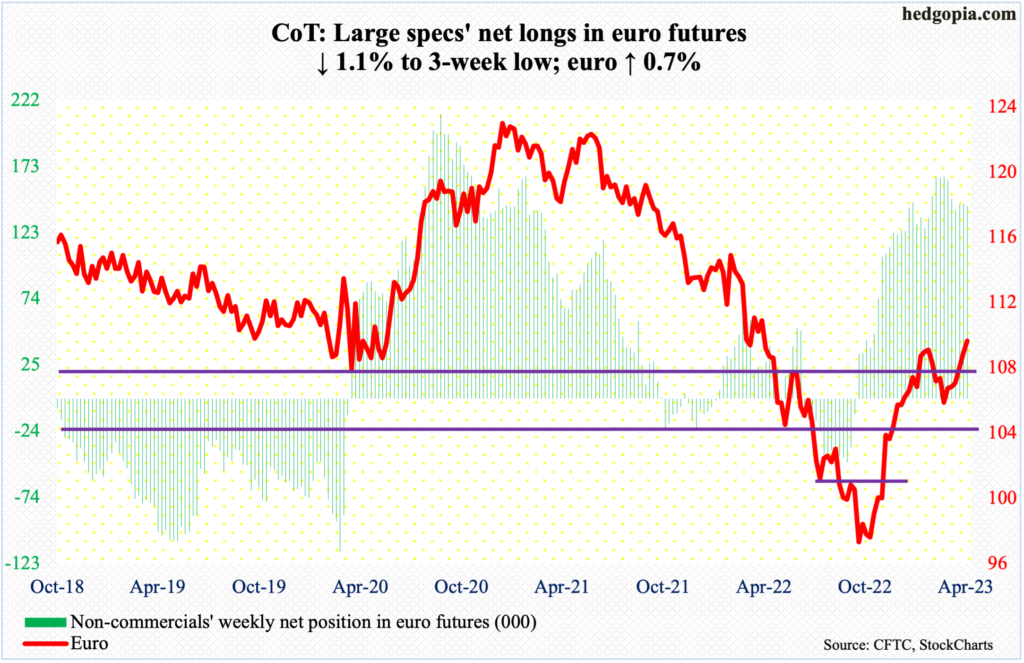
Euro bulls made progress toward recapturing $1.09-$1.10. The currency ended the week at $1.0924, up 0.7 percent; it rallied as high as $1.0973 on Tuesday. The level has resisted rally attempts several times this year. Early February, $1.1004 was tagged before sellers came out in droves.
This can occur again, as the daily is itching to trade lower.
In the event of downside pressure, bulls can still step up and defend the 50-day moving average ($1.0739), or, in a worse-case scenario, regroup near $1.04-$1.05, which has been an important level going back at least eight years and which was reclaimed last December.
Gold: Currently net long 195.2k, up 13.6k.
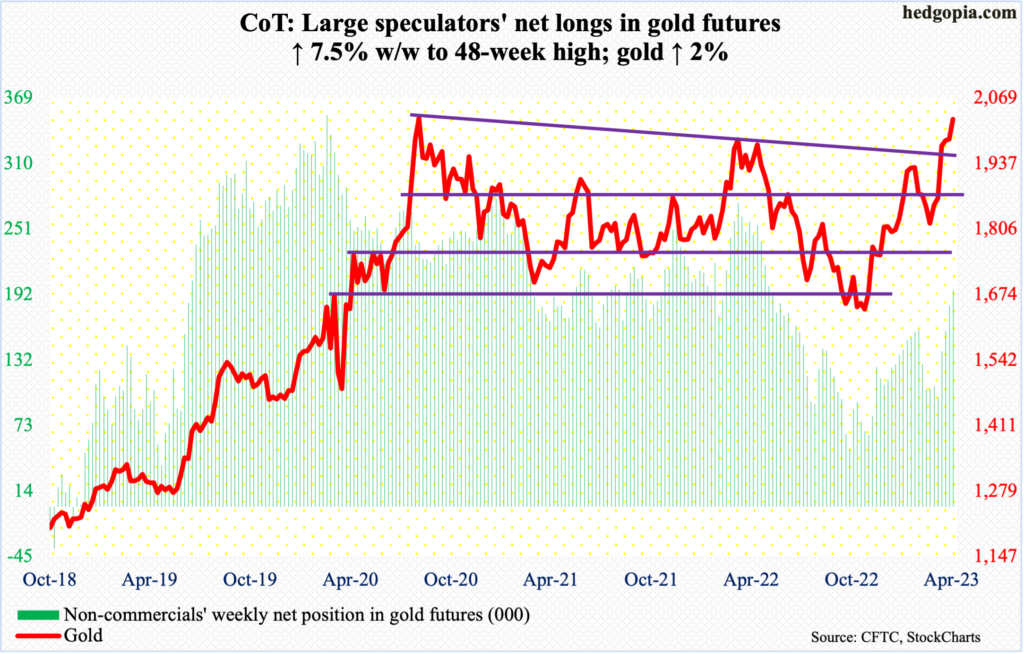
The third time is a charm. Gold bugs hope so.
Gold ($2,026/ounce) is approaching the level first hit in August 2020 ($2,089) and then March 2022 ($2,079). On both those occasions, the metal pulled back sharply shortly afterwards.
This week, in a spinning top session, gold ticked $2,049 intraday Wednesday. Gold bulls have prevailed so far, but the bears are hanging in there. The last three weeks have produced weekly candles with wide ranges, with the first two a spinning top.
Non-commercials are behaving as if a breakout is imminent. Net longs are at a 48-week high.
Nasdaq 100 index (mini): Currently net short 18.4k, up 11k.
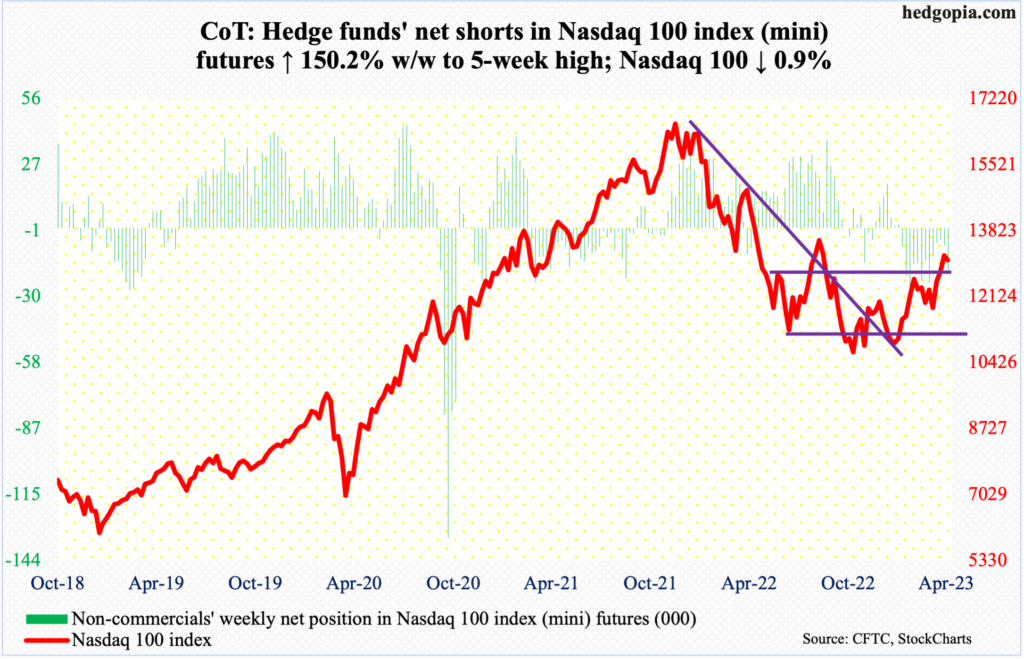
After three weeks of continuous rally, during which the Nasdaq 100 jumped 11.4 percent, the tech-heavy index shed 0.9 percent last week – a long-legged doji week.
Noticeably, tech was leading but the internals including the advance-decline line were struggling to conform (more on this here).
If weakness develops near term – likely – nearest support lies at 12800s, which has been an area of interest for both bulls and bears going back to December 2020 and which the index (13061) broke out of last week. This Friday, bulls defended 12800s.
Non-commercials probably expect the support to give way in the sessions ahead as they raised net shorts in Nasdaq 100 index (mini) futures to a five-week high.
Russell 2000 mini-index: Currently net short 57k, up 14.2k.
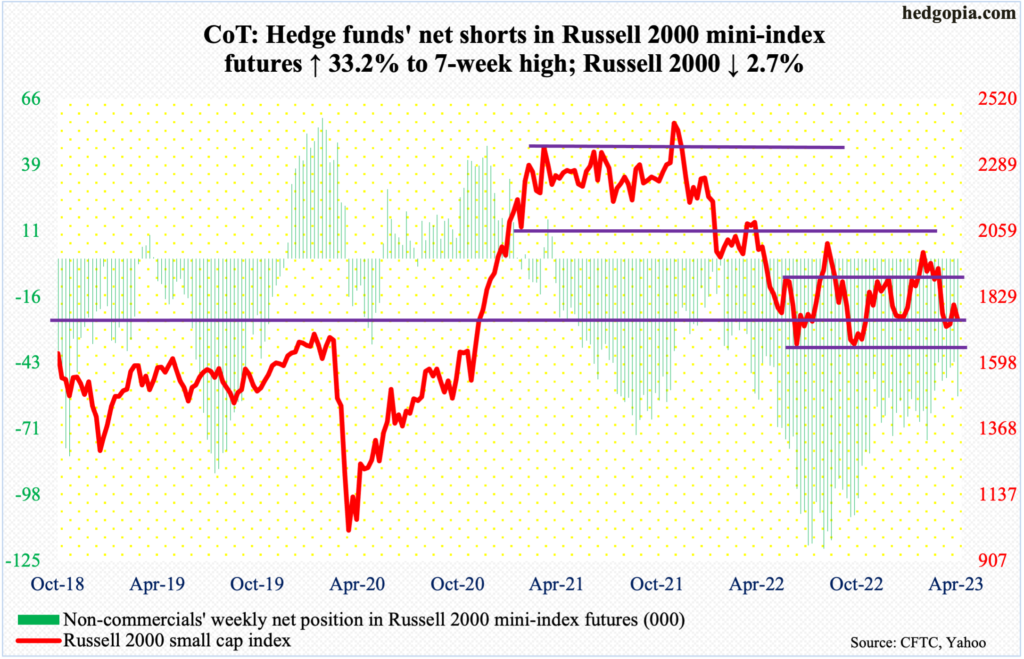
The Russell 2000 (1754) tried to maintain last week’s momentum touching 1812 intraday Monday, but the bids were simply no match for the offers as soon as resistance was hit. Selling picked up momentum at the underside of the broken rising trendline from last October.
Last week, small-cap bulls defended horizontal support at 1700, which goes back to August 2018. Their mettle could again be tested in the days and weeks ahead.
US Dollar Index: Currently net long 14.1k, up 1.4k.
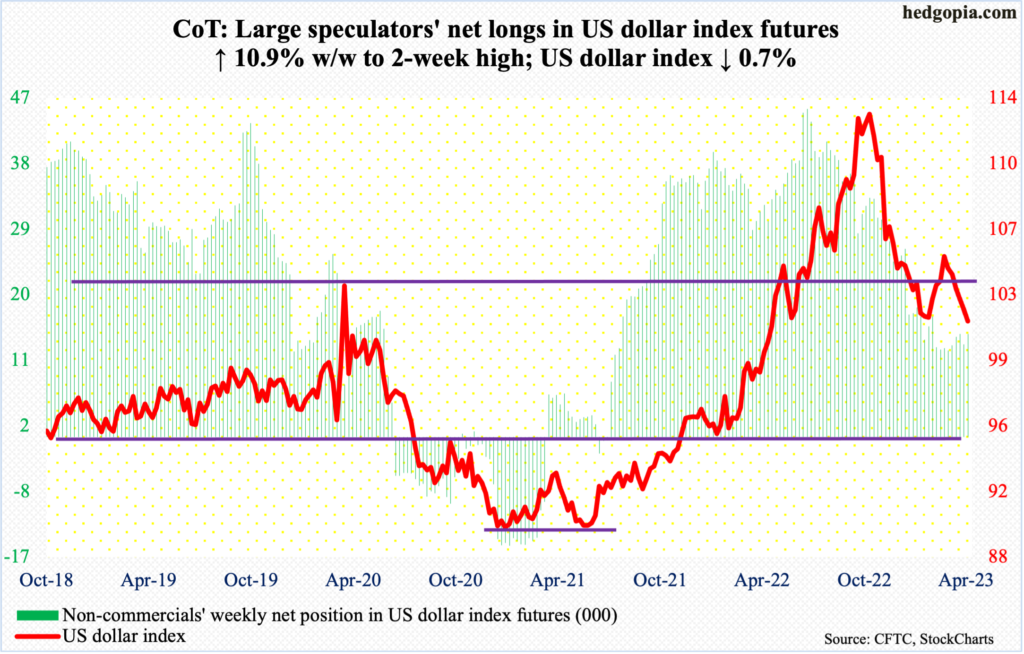
Last June, the US dollar index broke out of crucial 103-104. Subsequently in September, it tagged 114.75, before reversing. It dropped each month from October through January, rose in February and was down again in March. It has now dropped six weeks in a row, with a loss of 103-104 three weeks ago. This week, it slid 0.7 percent to 101.52.
Another crucial level lies at 100-101, which remains intact after several tests this week. On the daily, the US dollar index has room to rally. In this scenario, what happens at 103-104 is worth a watch.
VIX: Currently net short 57.1k, up 14.9k.
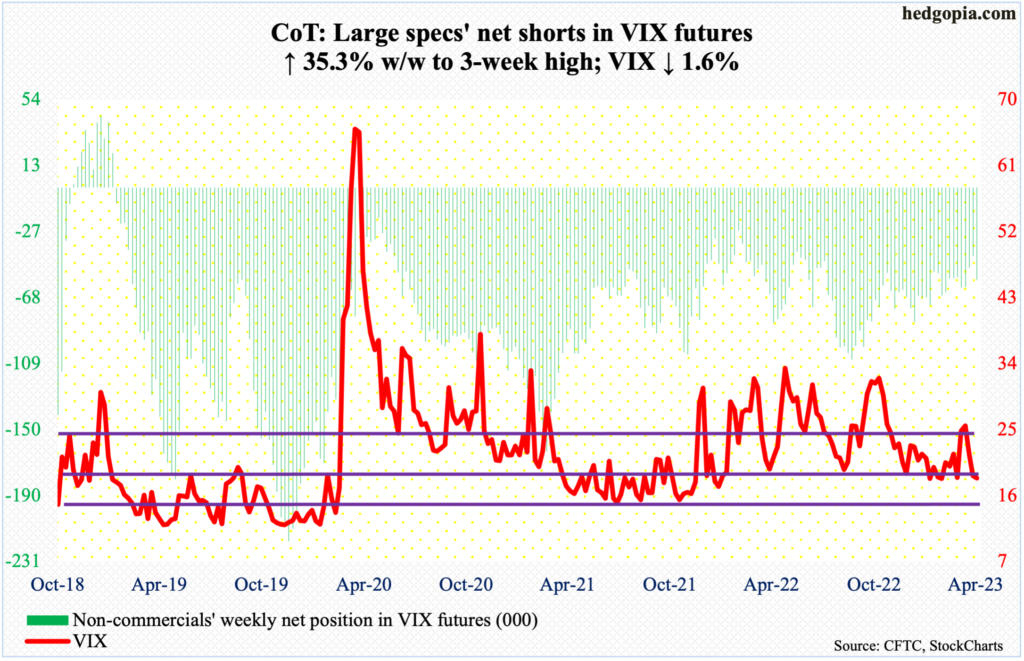
Rally attempts on Tuesday through Thursday only produced candles with long upper wicks. VIX has remained under the 50-day for nine sessions now.
With that said, the volatility index remains above a rising trendline from November 2017 when it printed an all-time low of 8.56. Right now, it will be tested around 17.50. So, in theory, VIX can drop to that support, bounce off of it and be just fine.
It may not even come to that. VIX is very oversold on the daily and can rally nicely in the right circumstances.
Thanks for reading!
More By This Author:
Ahead Of Friday's March Payrolls, February Openings Suggest Continued Softening In Job Creation
Tech Massively Outperforms In March, Internals And Small-Caps, Sow Doubts
CoT: Future Through Futures, Hedge Funds Positioning


Comments
Log in or sign up to join the conversation.