
Following futures positions of non-commercials are as of September 13, 2022.
10-year note: Currently net short 352.9k, down 23.4k.
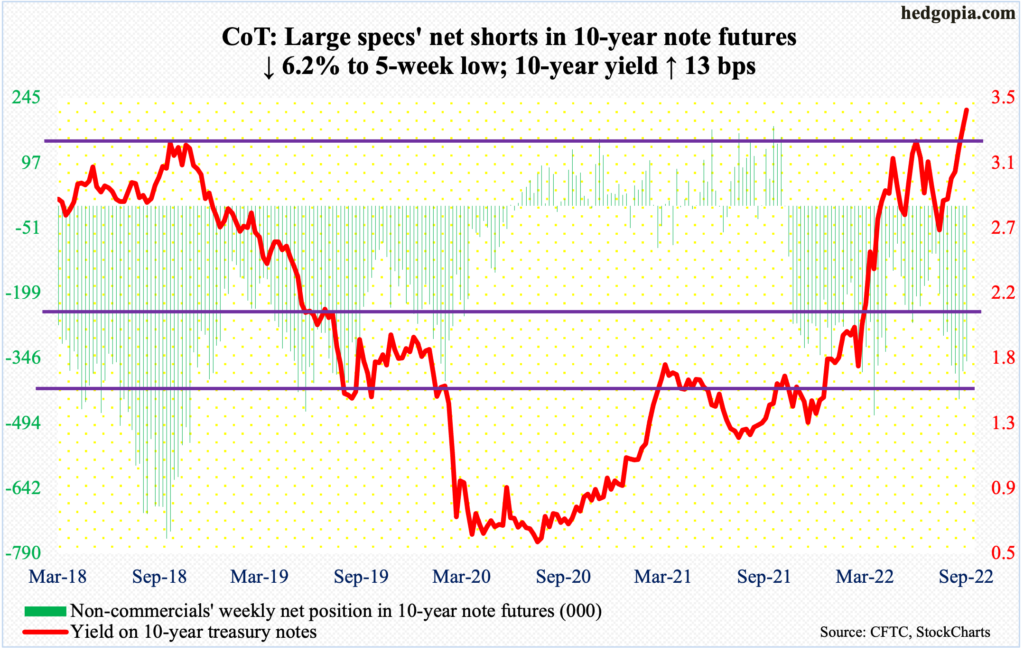
The FOMC meets next week. A 75-basis-point hike is baked in, with futures traders assigning an 82-percent probability for that move. In fact, post-CPI report for August – out Tuesday – these traders also began toying with a full percentage point increase, with odds of 18 percent.
The Federal Reserve would probably not want to shock the markets with a 100-basis-point move right at this moment. It is almost certain they will raise the fed funds rate by 75, to a range of 300 basis points to 325 basis points, and may do another with a similar increment come November, which is what is priced in currently. By December, the benchmark rates are expected to end between 400 basis points and 425 basis points.
With markets already this hawkish, Chair Jerome Powell is likely to lean toward shifting down the rhetoric a tad. If anything, by the time Wednesday’s post-meeting press conference is over, it is possible his message gets interpreted as less hawkish versus how he has sounded recently.
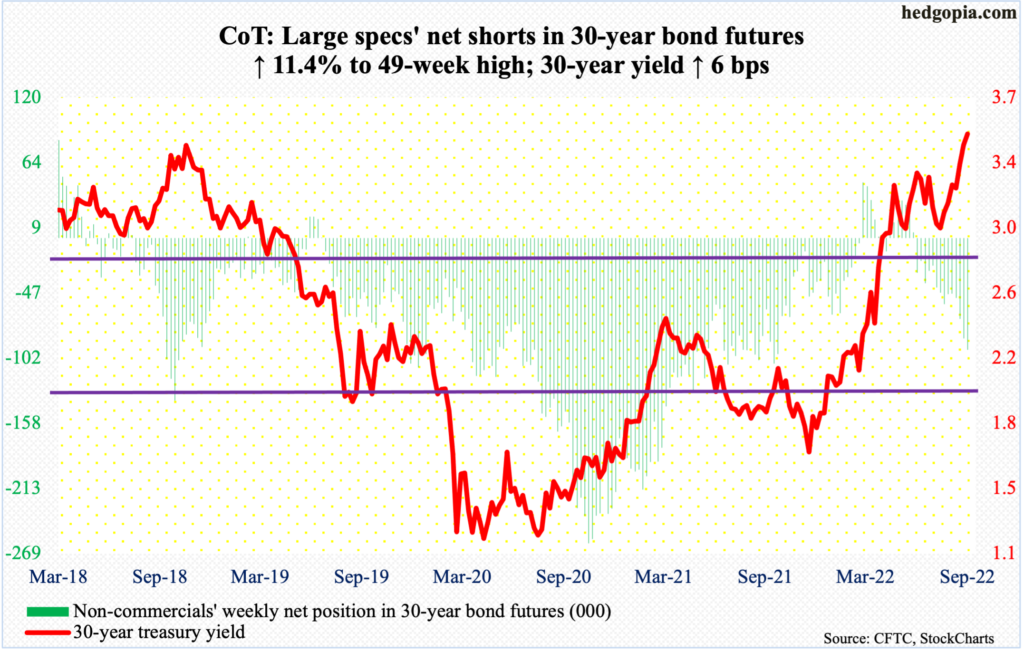
30-year bond: Currently net short 95k, up 9.8k.
Major economic releases for next week are as follows.
The NAHB housing market index (September) is scheduled for Monday. Homebuilder optimism fell six points month-over-month in August to 49. This was the lowest print since May 2020.
Housing starts (August) are due out on Tuesday. In July, starts dropped 9.6 percent m/m to a seasonally adjusted annual rate of 1.45 million units. This was a 23-month low. As recently as April, starts crested at 1.81 million units.
Existing home sales (August) will be reported on Wednesday. July sales declined 5.9 percent m/m to 4.81 million units (SAAR) – a 25-month low.
WTI crude oil: Currently net long 241k, up 9.9k.
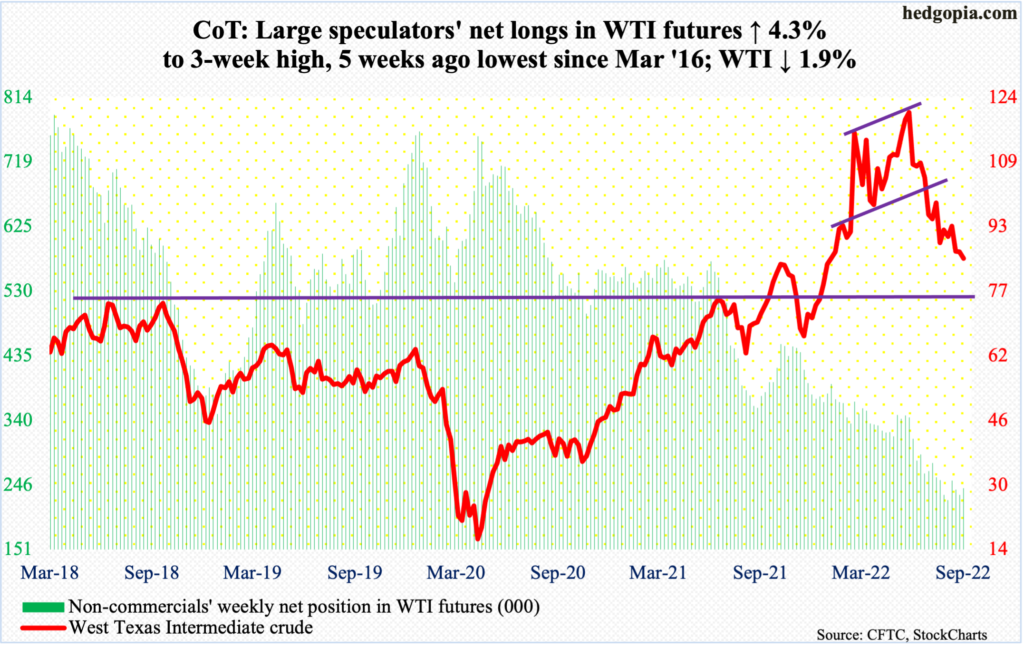
Lateral support at $85, or just underneath, continued to get tested this week. Both oil bulls and bears are desperately trying to stake a claim to this level, which has acted as a magnet the last several weeks.
The longer this goes on, the higher the risk of a breakdown. Earlier, WTI ($84.76/barrel) peaked at $123.68 in June and at $130.50 in March before that. Subsequently, bulls lost important horizontal support at $93. A loss of $85 will be another bearish development in this regard.
In the meantime, per the EIA, US crude production in the week to September 9 was unchanged at 12.1 million barrels per day. Crude imports decreased 987,000 b/d to 5.8 mb/d. As did gasoline stocks, which declined 1.8 million barrels to 213 million barrels. Crude and distillate stocks, however, increased 2.4 million barrels and 4.2 million barrels to 429.6 million barrels and 116 million barrels, in that order. Refinery utilization rose six-tenth of a percentage point to 91.5 percent.
E-mini S&P 500: Currently net short 281k, up 42.3k.
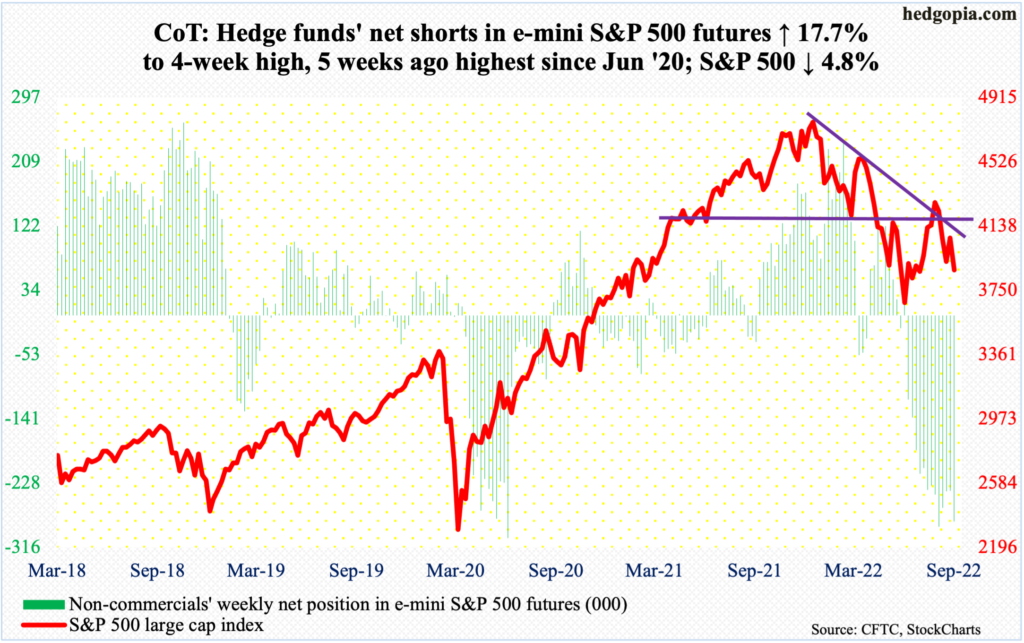
It was a classic case of the ‘escalator up, elevator down’ phenomenon. In four sessions between last Tuesday and this Monday, the S&P 500 rallied from 3908 to 4110. Then, in one fell swoop on Tuesday, the large cap index gapped down to close at 3933. In the end, it shed 4.8 percent for the week to 3873. A rising trendline from June’s low when the index tagged 3637 has been breached, raising the possibility of a retest.
If there is any consolation for the bulls, it is that Friday’s low of 3837 was bought to produce a potentially bullish hammer session.
Longer-term, households’ equity allocation fell further in 2Q to 32.4 percent, after having peaked at 37.7 percent in 4Q21, but the metric remains elevated versus prior major peaks in 2Q07 and 1Q00 (chart here).
Euro: Currently net short 11.8k, down 24.5k.
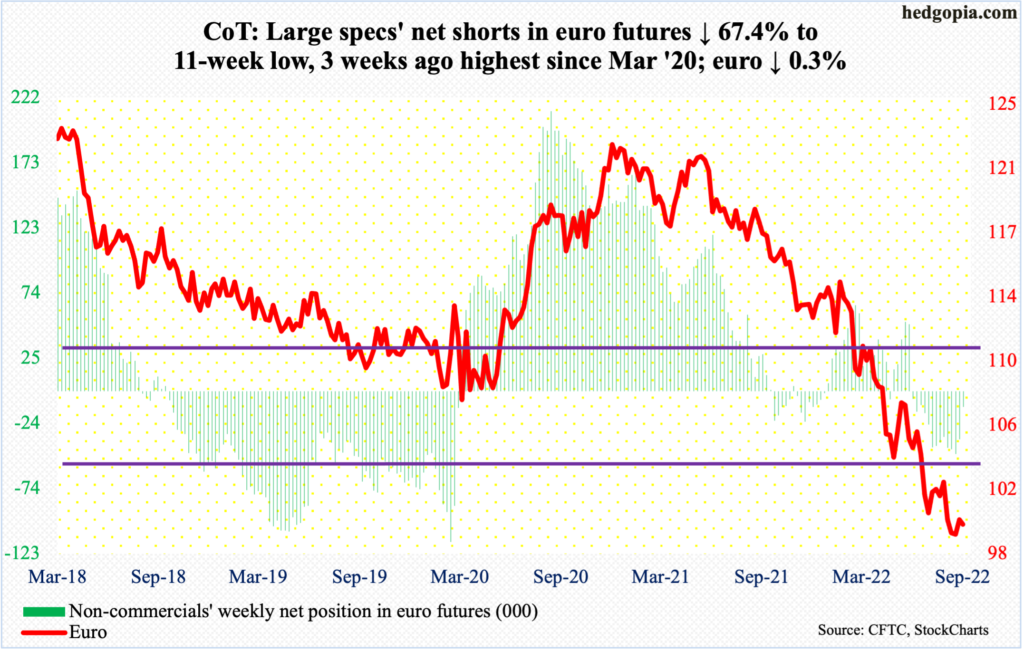
The week started out strong with Monday’s 0.8-percent rally, but only to then get smacked down with Tuesday’s 1.5-percent tumble.
In the end, $1.01 was recaptured only briefly – on Monday, that is – before the currency ($1.0015) dropped back into the sideways pattern it has been in the past couple of months.
Amidst this, daily Bollinger bands have tightened, which usually occurs just before a sharp move – either up or down – unfolds. As this stage, risk-reward odds favor it will be to the upside.
Gold: Currently net long 97.3k, down 6.5k.
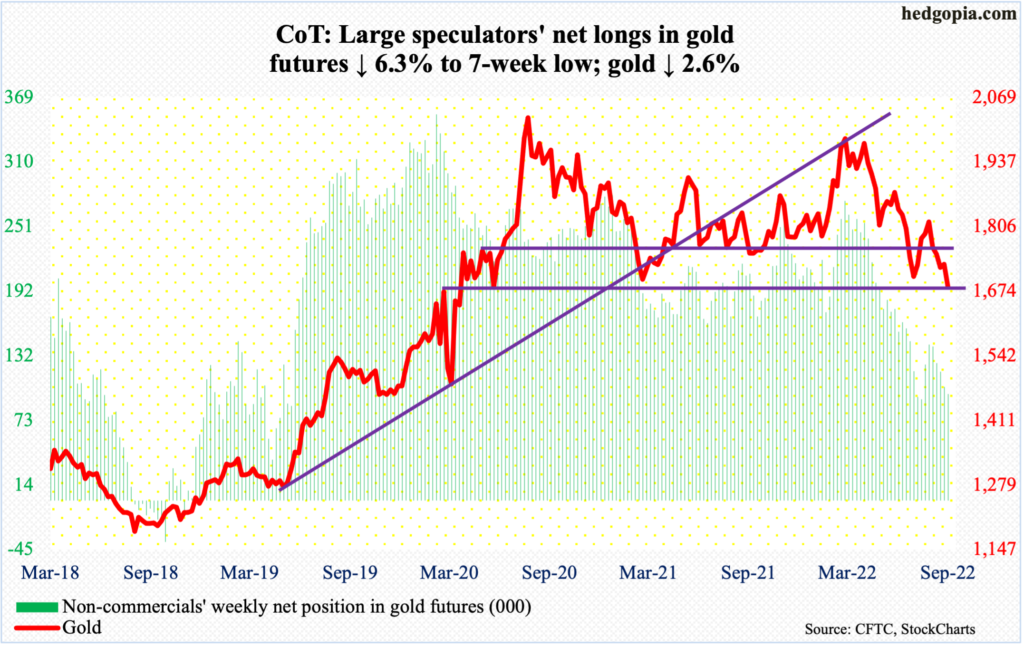
The last time gold closed above $1,760s-$1,770s was five weeks ago, with attempts to reclaim the level denied toward the end of last month.
This week, the metal ($1,683/ounce) tested lower support at $1,670s, which, going back to the early months of 2020, has been tested several times, including this July.
Inability to defend $1,670s can prove costly for gold bugs. Longer-term, there is dual support at $1,360s – horizontal going back to the latter months of 2010 and a rising trendline from December 2015 when gold bottomed at $1,045.
Nasdaq 100 index (mini): Currently net long 11.8k, down 10.2k.
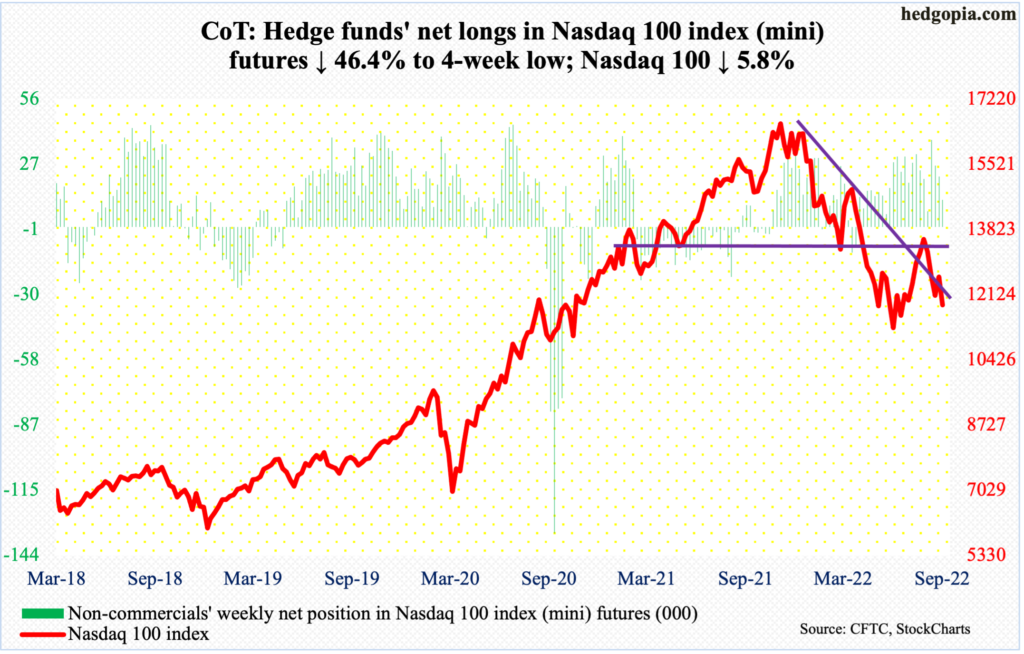
The Nasdaq 100 (11861) this week reversed from up 1.2 percent at Monday’s close to down 5.8 percent by Friday. This was the fourth weekly decline in the last five.
Tech bulls had an opportunity to build on last week’s positive momentum but came up short. They need to reclaim 11900s as soon as possible. Else, the odds of a retest of the June 16 low of 11037 go up.
Russell 2000 mini-index: Currently net short 99.2k, up 3.5k.
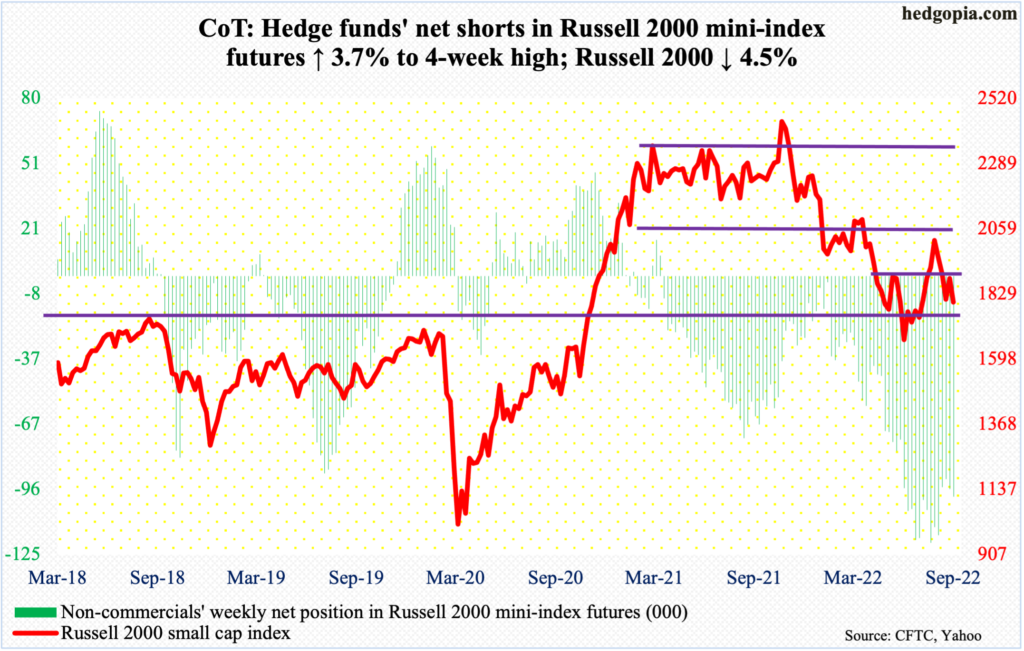
Two weeks ago, the Russell 2000 closed just north of 1800. Then last week, it closed just under 1900, with this Monday touching 1906 intraday, before heading back toward 1800.
This has been the latest range within which the small cap index (1798) has gone back and forth.
To recall, a major breakdown occurred mid-January, losing 2080s; for 10 months before that, the Russell 2000 played ranges between 2080s and 2350s, followed by a seesaw action between 2080s and 1900 and between 1900 and 1700 after that; 1700 is where it broke out of in November 2020. The breakout retest was successful.
The inability to break one way or the other arguably is reflective of the stage of the US economy, with investors awarding low probability to a hard-landing scenario but not expecting acceleration in activity anytime soon either (more on this here).
US Dollar Index: Currently net long 35.7k, down 438.

As soon as September began, the US dollar index witnessed a mini-break out of 109.10s, subsequently ticking 110.78 on the 7th. The breakout level was challenged in the first two sessions this week, with a loss on Monday and a reclaiming on Tuesday.
Amidst this back-and-forth, some subtle signs of fatigue have appeared. But unless 104, which the index (109.74) broke out of in June, is breached, bulls are unlikely to sweat anytime soon.
VIX: Currently net short 98.5k, up 9.8k.
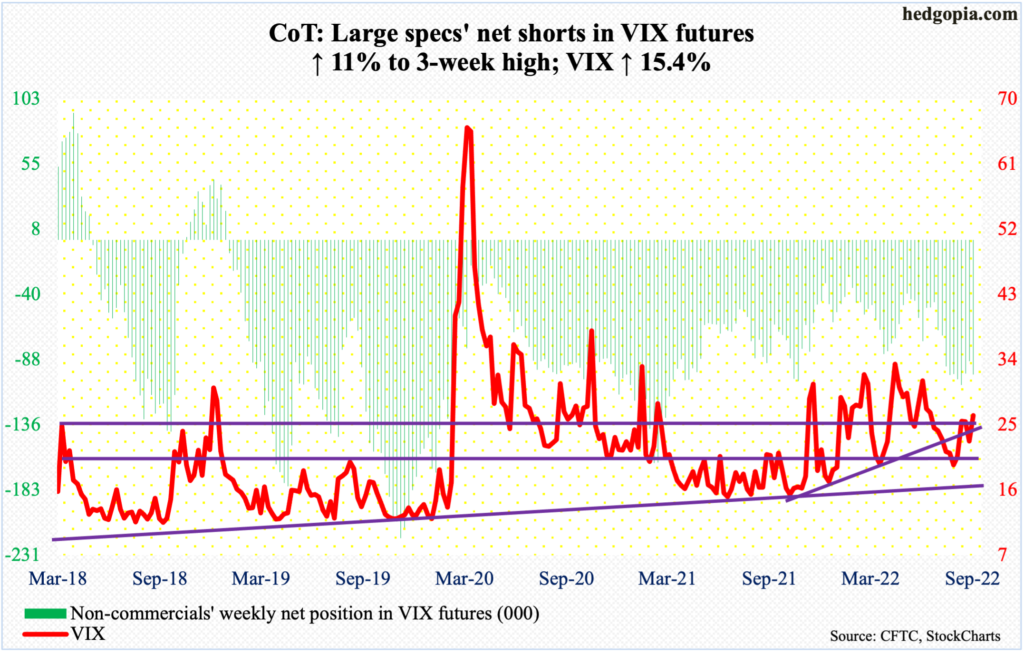
Once again, volatility bulls went after 27.60s with VIX tagging 28.15 on Tuesday and 28.45 on Friday. And once again, they met with failure. The volatility index has been denied at that level since late August, closing out the week at 26.30.
Inability to bust through the resistance raises the odds of a move lower toward lower supports. Should mid-20s go, low-20s is the next level to watch.
Thanks for reading!
More By This Author:
US Small-Cap Profit Trend Tumbles In August
Tue’s CPI To Decide If Non-Commercials Will Cover Short Bets On Large-And Small-Caps
CoT Report - Futures Positions of Non-Commercials


Comments
Log in or sign up to join the conversation.