

Image Source: Pexels
That’s the title of today’s segment on WPR’s Central Time, where I was the guest. In my view, the reason why the economy has proved so durable thus far is in large part attributable to the resilience of the consumer, buoyed by Covid era transfer payments. With the path of disposable income higher than thought just a month ago, consumption has been higher, and — with the saving rate lower in the context of a tight labor market — the cushion of “excess savings” is larger.
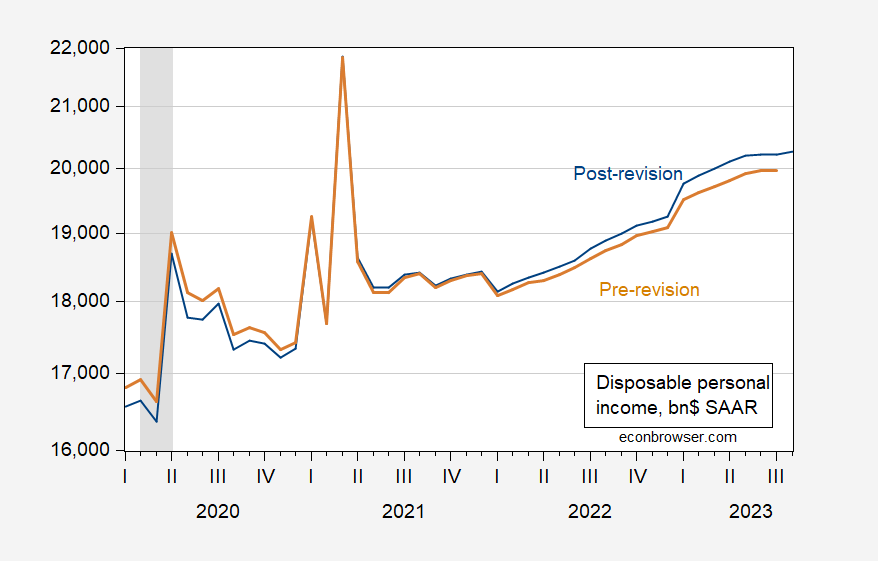
Figure 1: Pre-comprehensive revision disposable income (tan), post-comprehensive revision (blue), in billions $, SAAR. NBER defined peak-to-trough recession dates shaded gray. Source: BEA via ALFRED, NBER.
Wells Fargo estimates “excess savings” at about $1.1 trillion in August using post-revision data, compared to about $340 billion in July, using pre-revision data. How can this be when the cumulative difference in disposable income is about $153 billion, and the cumulative difference in consumption is $453 billion (i.e., post-revision, consumption has been much higher)? The difference arises from the lower assumed saving rate (7.2% vs. prior 9.1%), which defines downward the “normal” level of savings, and hence upward the level of “excess savings”.
So, continued strength in consumption is not surprising.
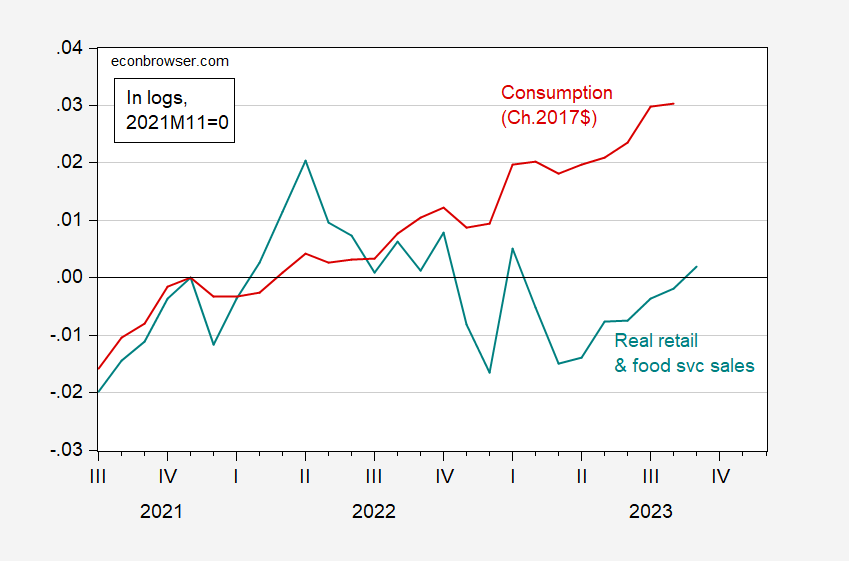
Figure 2: Real retail and food service sales (teal), and real consumption (red), both in logs, 2021M11=0. Retail and food service sales (FRED series RSAFS) deflated by Chained CPI (seasonally adjusted by X13). Source: Census, BLS, BEA and author’s calculations.
As the resilience of the economy has shown up again and again, and the date of a posited recession gets pushed further back – or cancelled (see this post) – the Fed funds path gets pushed further up. See the path pre-comprehensive GDP revision vs. post, in Figure 3 below.
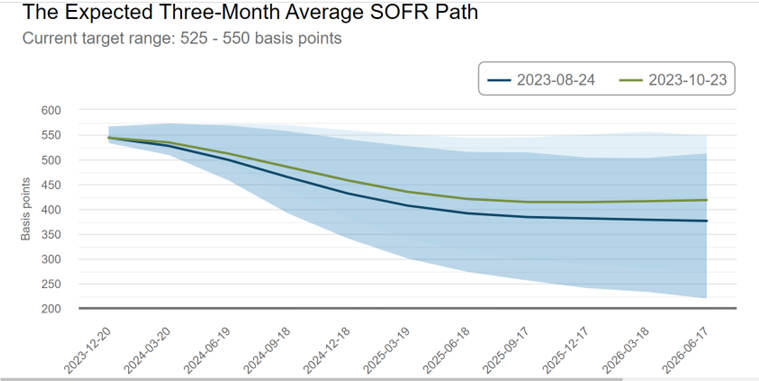
Figure 3: Implied path of Fed funds, from Atlanta Fed on 8/24 (blue) and 10/23 (green). Source: Atlanta Fed probability tracker, accessed 10/24.
More By This Author:
More On China Q3 GDP
China GDP Growth In Q3
Mean And Median Cumulative Wage Growth


Comments
Log in or sign up to join the conversation.