

BOFIT calculations (based on Kerola (2019)) indicate a slower pace of growth than officially reported. Year-on-Year, the simple average of alternative calculations is less than 4%, compared to the 4.9% officially reported (which is at the top of the range of growth rates from the alternative calculations).
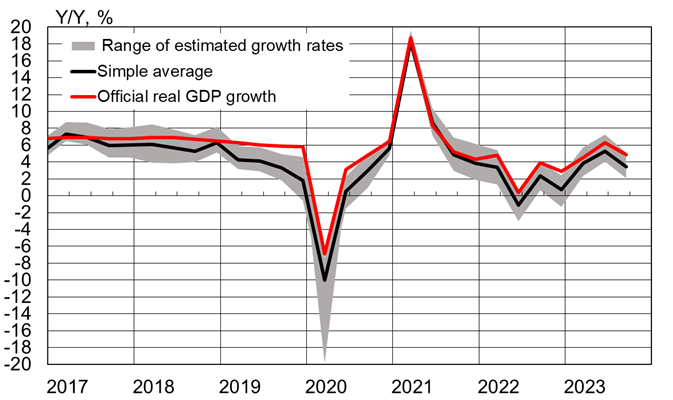
Source: BOFIT.
Interestingly, the Q2 gap is not as large as that reported by Fernald et al. as discussed in this post: 3.9% vs. 6.3%. The Fernald et al. approach places greater weight on trade data than does the various approaches adopted by Kerola (2019), so there is no particular reason for the estimates to match.
More By This Author:
China GDP Growth In Q3
Mean And Median Cumulative Wage Growth
Inflation: Known Unknowns


Comments
Log in or sign up to join the conversation.