
Q/Q was 1.3% vs. consensus 1%.
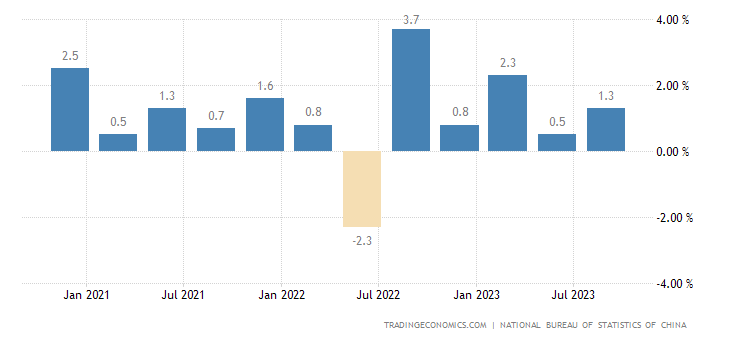
Source: TradingEconomics.
Some skepticism is warranted, given CCAT’s implied numbers for Q2 (on a year-on-year basis), discussed in this post:
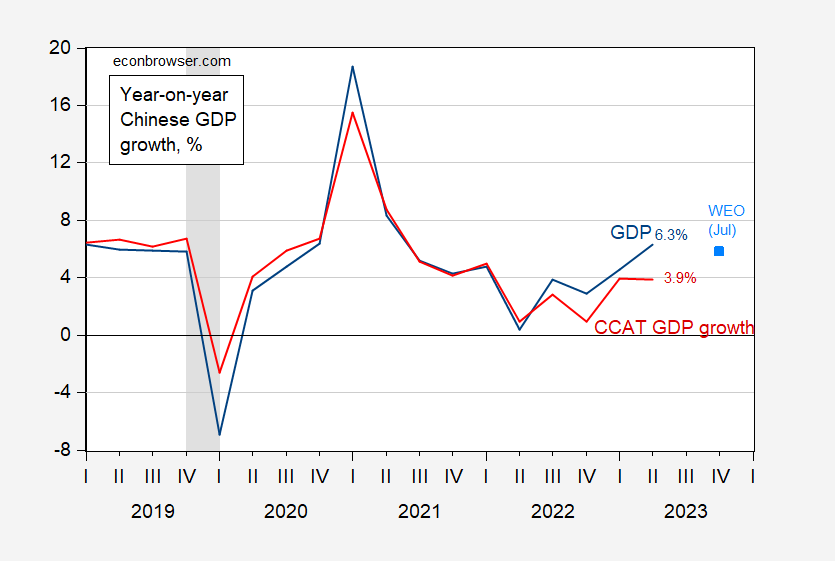
Figure 2: Year-on-Year Chinese GDP growth (blue), and growth implied by China CAT (red), IMF WEO July forecast (sky blue square). ECRI defined peak-to-trough recession dates shaded gray. Source: NBS, personal communication, IMF WEO July update, ECRI and author’s calculations.
Natixis wrote yesterday:
Despite the encouraging momentum, three concerning factors are still at play. First, fixed asset investment in real estate continued to edge downward to -9.1% in September from -7.9% in June, posing concerns about the potential spillover effect on the sector, including local governments’ finances. Second, the CPI remains hovering around 0%, which signals stagnant demand. Third, China’s geopolitical relationship with the West remains a concern, especially after the US’ decision to tighten export controls on China.
More By This Author:
Mean And Median Cumulative Wage GrowthInflation: Known Unknowns
Business Cycle Indicators, Mid-October


Comments
Log in or sign up to join the conversation.