
Industrial production -0.9% vs. +0.1% consensus (m/m). Here are some key indicators followed by the NBER’s BCDC, plus monthly GDP.
(Click on image to enlarge)
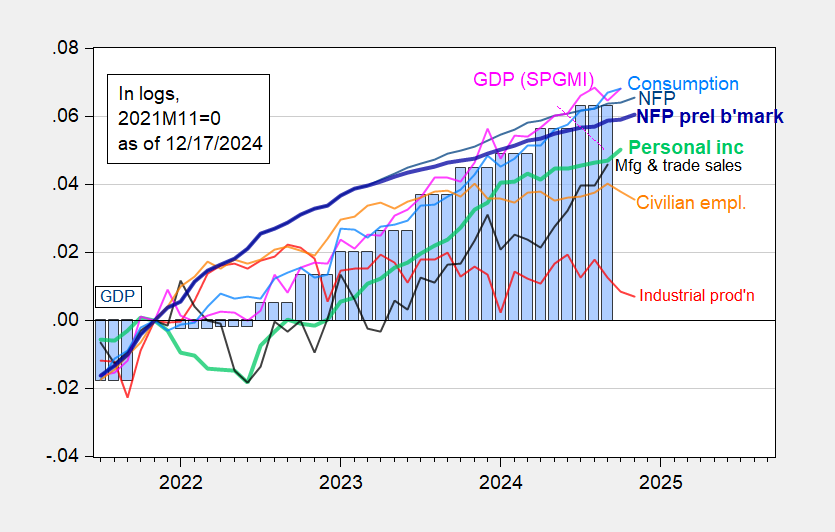
Figure 1: Nonfarm Payroll (NFP) employment from CES (blue), implied NFP from preliminary benchmark (bold blue), civilian employment (orange), industrial production (red), personal income excluding current transfers in Ch.2017$ (bold light green), manufacturing and trade sales in Ch.2017$ (black), consumption in Ch.2017$ (light blue), and monthly GDP in Ch.2017$ (pink), GDP (blue bars), all log normalized to 2021M11=0. Source: BLS via FRED, Federal Reserve, BEA 2024Q3 2nd release, S&P Global Market Insights (nee Macroeconomic Advisers, IHS Markit) (12/2/2024 release), and author’s calculations.
Manufacturing recovered somewhat, but still below consensus (+0.2% vs. +0.5%consensus(m/m)).
(Click on image to enlarge)
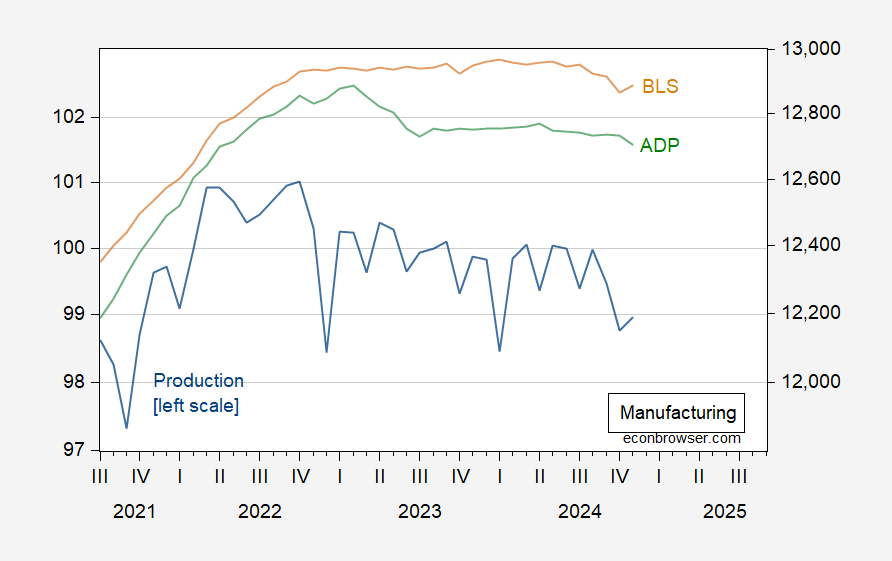
Figure 2: Manufacturing production (blue, left log scale), manufacturing employment from BLS, 000’s (tan, right log scale), manufacturing employment from ADP-Stanford Digital Economy Lab, 000’s (green, right log scale), all s.a. Source: Federal Reserve, BLS, ADP all via FRED.
Core retail sales were also below consensus (+0.2% vs. +0.4% m/m), while total retail sales slightly above (+0.7% vs. +0.6% m/m).
Hardly accelerating growth, but too early to declare recession, given increases in employment and personal income in November.
More By This Author:
If You Thought Construction Costs Were High, Wait For Mass DeportationIf You Thought Grocery Prices Were High, Wait For Mass Deportation
Trump: “Tariffs Are Going To Make Our Country Rich”


Comments
Log in or sign up to join the conversation.