
With the release of December 2022 consumption and personal income, and November real manufacturing and trade industry sales, plus Q4 GDP, we have the following picture of business cycle indicators followed by the NBER Business Cycle Dating Committee, along with IHS Markit monthly GDP:
(Click on image to enlarge)
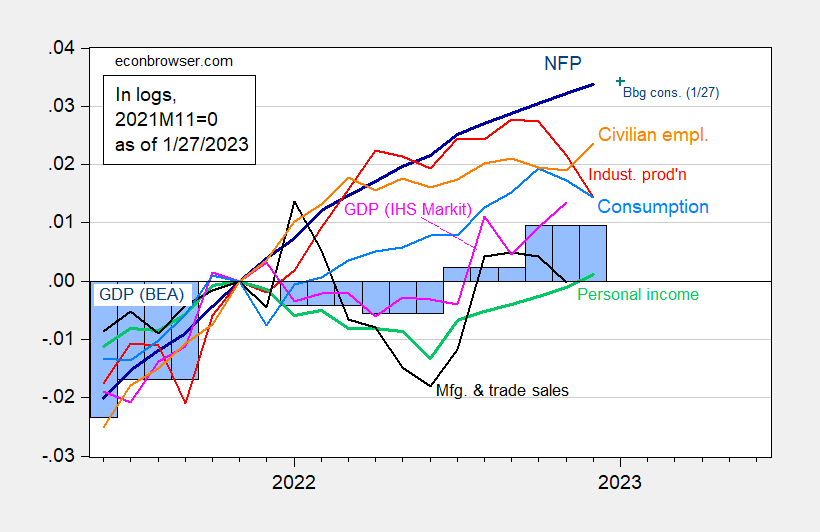
Figure 1: Nonfarm payroll employment, NFP (dark blue), Bloomberg consensus as of 1/27 (blue +), civilian employment (orange), industrial production (red), personal income excluding transfers in Ch.2012$ (green), manufacturing and trade sales in Ch.2012$ (black), consumption in Ch.2012$ (light blue), and monthly GDP in Ch.2012$ (pink), GDP (blue bars), all log normalized to 2021M11=0. Q3 Source: BLS, Federal Reserve, BEA, via FRED, IHS Markit (nee Macroeconomic Advisers) (1/3/2023 release), Bloomberg (as of 1/27) and author’s calculations.
While GDP grew at 2.9% Q/Q SAAR in quarter 4, exceeding Bloomberg consensus (2.6%) (see Jim’s post), the increase in inventories points to a drawback in 2023Q1. Along with the slowdown in consumption, and weaker exports in December (not shown), we have a definite slowdown in Q1 nowcasts/tracking estimates.
(Click on image to enlarge)
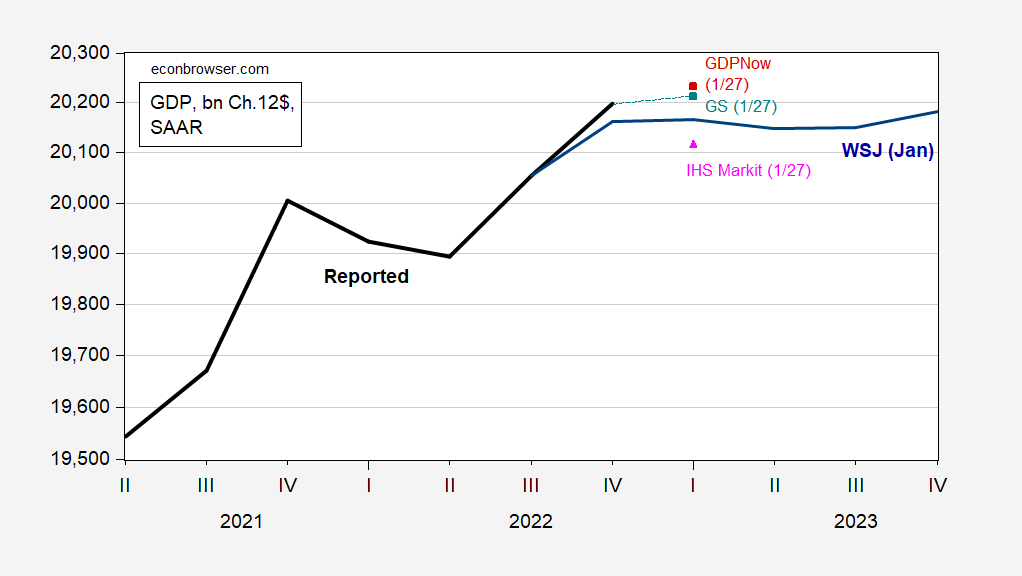
Figure 2: GDP (bold black), WSJ December survey mean (dark blue), GDPNow (red square), Goldman Sachs (teal square), IHS Markit/S&P Global (pink triangle), all in bn. Ch.2012$ SAAR. Source: BEA 2022Q4 advance, WSJ, Atlanta Fed (1/27), Goldman Sachs (1/27), and IHS Markit (1/27), and author’s calculations.
IHS Markit tracking indicates 1.6% decline in Q1 (Q/Q SAAR).
More By This Author:
Fed Hasn’t Stopped GDP From GrowingInstantaneous Inflation
Why Friends Don’t Let Friends Calculate 18 Month Not-Seasonally Adjusted Growth Rates


Comments
Log in or sign up to join the conversation.