
This past weekend’s Newsletter discussed how yield curve un-inversions have an excellent track record of predicting recessions. Another historically reliable indicator of recessions is weakness in the corporate credit markets. In mid-July, we highlighted a troubling divergence between the best and worst-rated junk bonds in our Daily Commentary, The Credit Widening In The Coal Mine.
Our canary is the difference between the highest-rated junk bonds, BB, and the junk bonds closest to default, CCC. As shown, CCC bond spreads have been rising. However, BB spreads continue to drift lower. The increased spread between BB and CCC is only minor. In other words, the canary just coughed. Let’s watch the canary to see if its condition worsens.
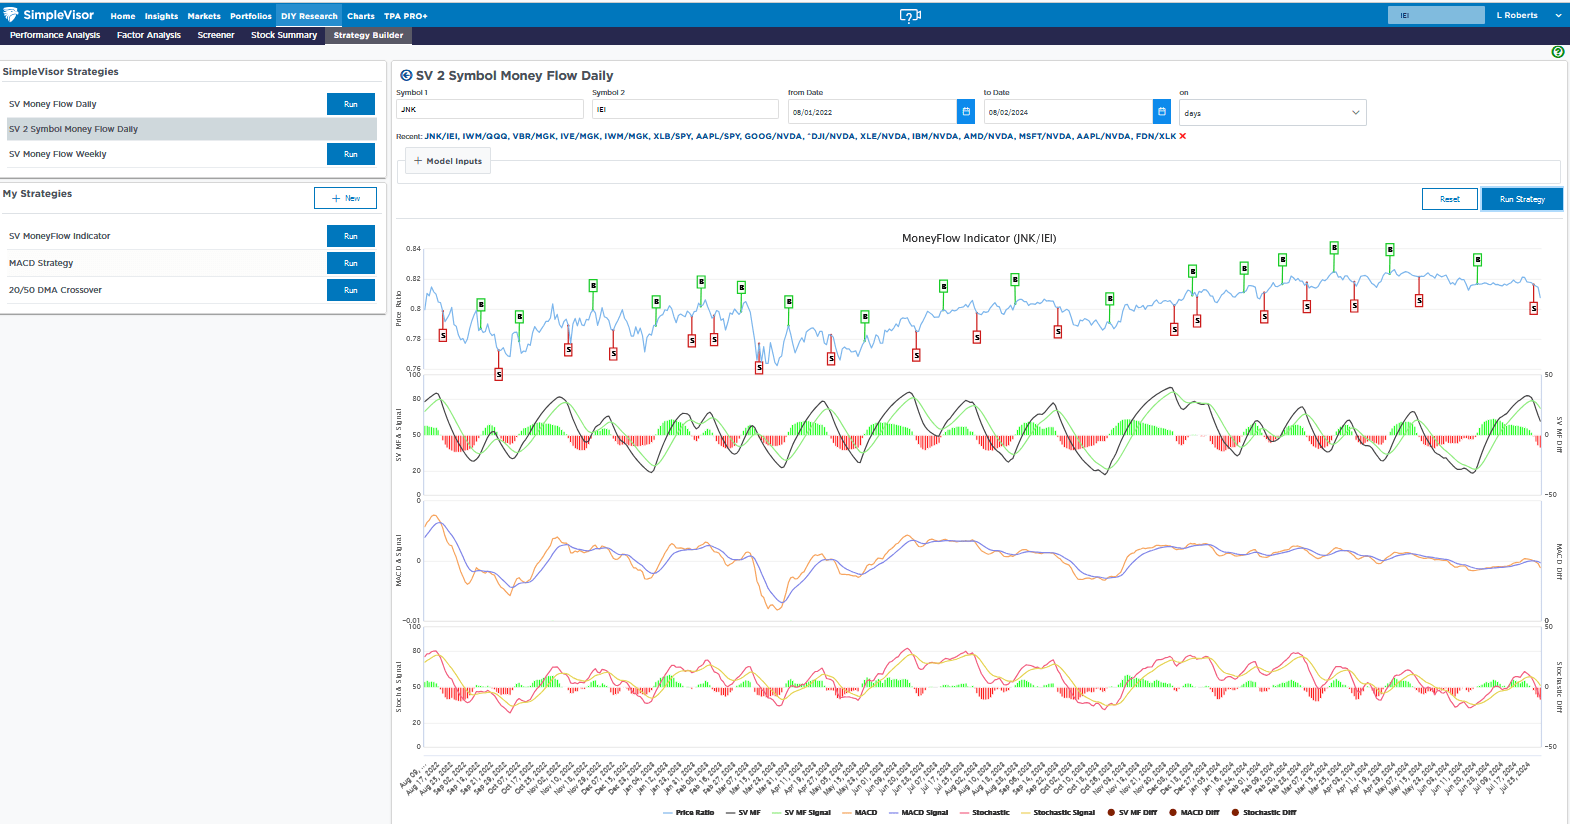
The credit market canary is still coughing. The graph below shares a unique SimpleVisor tool that allows us to gauge the technical situation of the corporate credit markets. The screenshot captures the price ratio of a popular junk-rated bond ETF (JNK) to the 3-7-year U.S. Treasury ETF (IEI). The relationship serves as a proxy for credit spreads. The top blue line charts the price ratio. The long-standing outperformance of JNK vs. IEI has reversed. Further, in just two weeks, the price ratio erased its year-to-date gains. The graphs below the blue line show our proprietary stochastic model, the MACD, and a popular stochastic model. All three show the JNK/IEI relationship is on a sell signal. Moreover, as the price ratio rose this year, the three indicators were setting lower highs.
The canary is far from keeling over, but like the yield curve, credit spreads should be followed closely if the economy continues to weaken.
(Click on image to enlarge)
What To Watch Today
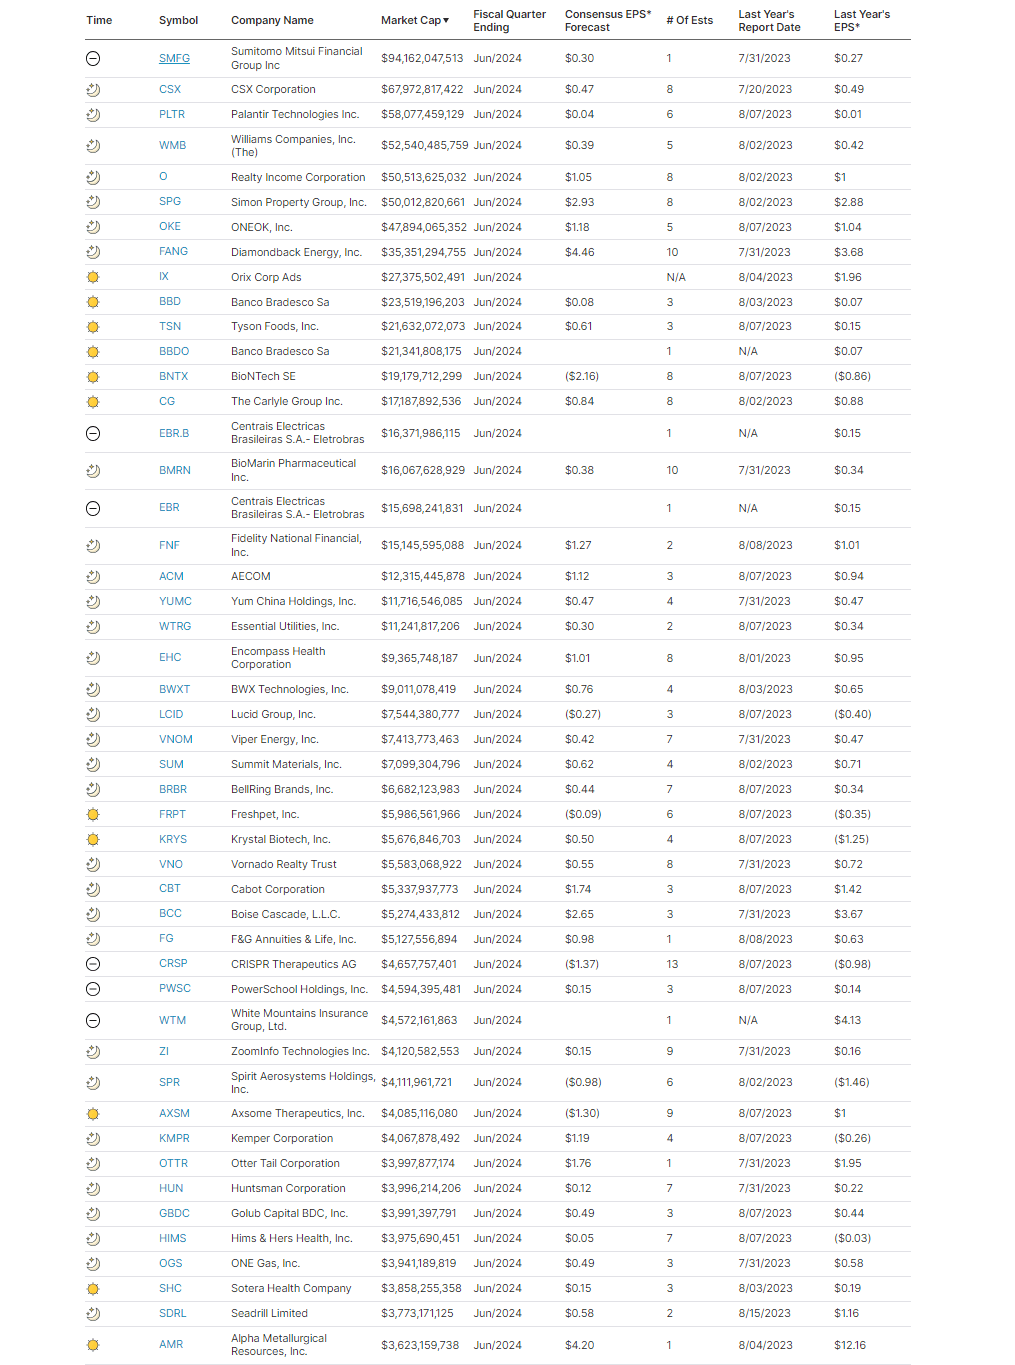
Earnings
(Click on image to enlarge)
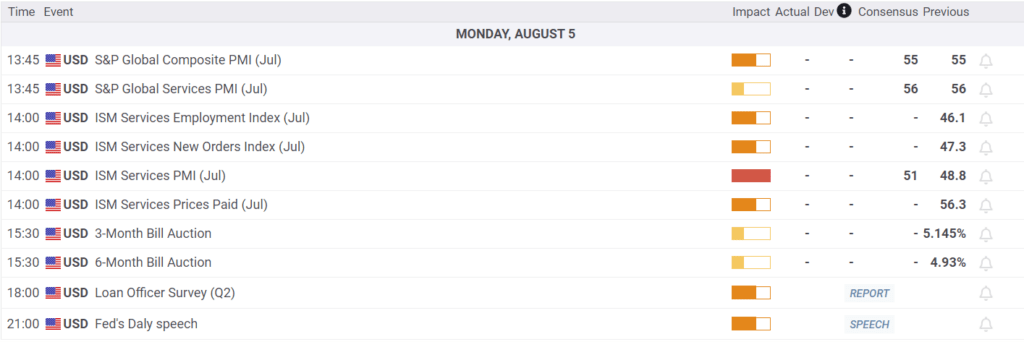
Economy
Market Trading Update
As noted last week, the continuation of the market correction is unsurprising.
“However, while the markets are oversold enough for a reflexive bounce, the current correction process is likely incomplete. Moreover, the MACD “sell signal” also suggests that the current upside remains limited.
It is quite likely that any short-term, reflexive rally will fail during this corrective process. For now, use rallies to rebalance portfolios and reduce risk as needed. Our only concern is that with investors remaining very bullish despite the recent pullback, a further correction is required to resolve that condition.
Such happened this past week, with a strong rally on Wednesday that failed. What is clear is the market is starting to recognize that Federal Reserve rate cuts are not bullish for stocks. As we have discussed, when the Fed cuts rates, it often coincides with weaker economic activity, which precedes a decline in earnings growth. The drop in the ISM manufacturing index and a terrible employment report bolstered those concerns. Unsurprisingly, the market is beginning to discount the impact on earnings by reducing stock prices.
While the correction has been quite normal, Friday’s break of the 50-DMA suggests the correctional process continues. As we discussed in June and July, a 5-10% correction was likely, and we are in the middle of that process. The market is getting decently oversold, and we are likely seeing a short-term exhaustion of sellers. Notably, the market held the 100-DMA on Friday, which was critical support during the April correction. With markets oversold, we would be unsurprised to see a reflexive rally next week. Use rallies to rebalance risk and reduce exposure as needed.
(Click on image to enlarge)
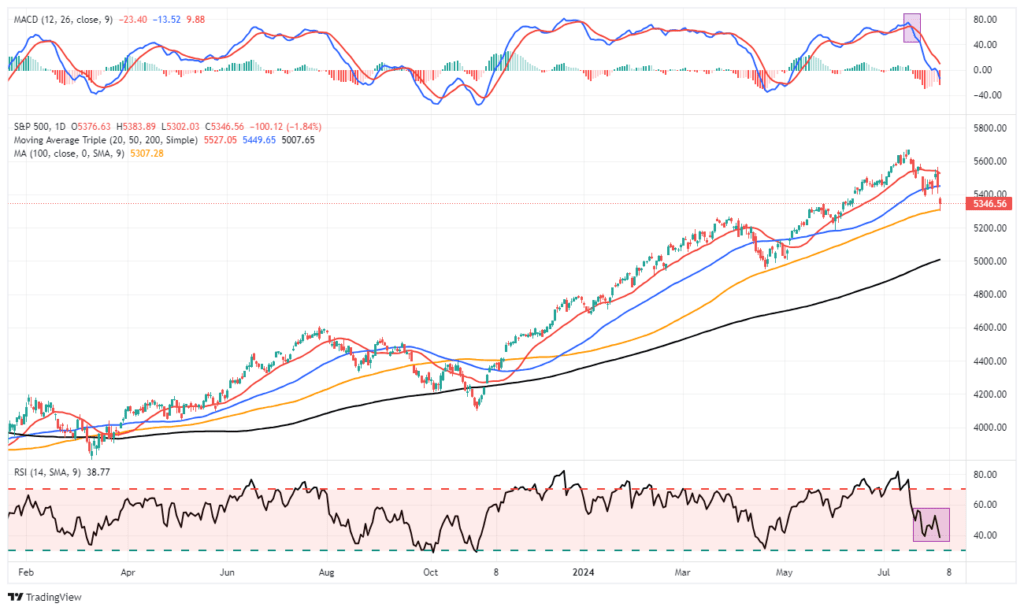
We are seeing a consistent string of weaker-than-expected economic data, which suggests the economy is slowing more than headlines suggest.
The Week Ahead
The bulk of corporate earnings are now behind us. Nvidia’s earnings report on August 28 will be the next big one for the market. Accordingly, with stock buyback blackouts over, stock buybacks may provide some ballast to the market.
Fed members will hit the speaking circuit this week, and we presume many of them will cement the idea of a rate cut in September. More importantly, we look forward to hearing their views on whether 50bps in September is appropriate and the total cuts they expect for the year.
ISM Services on Monday will help the market better assess inflation and employment. As we noted, the ISM manufacturing employment report was decidedly weak. Jobless claims on Thursday will also shed more light on the labor market.
The BLS Labor Report Triggers Calls For A 50bps Rate Cut
The employment situation took a turn for the worse on Friday. The BLS employment report headline gain of 114k jobs was 60k weaker than expected. Furthermore, last month’s figure was revised lower by 27k jobs. However, as we have seen in the previous few months, the underlying data points to more weakness than the headline figure. The unemployment rose two-tenths of a percent to 4.3%, while average hourly earnings and hours worked fell. The U6 unemployment rate, which is more encompassing than the oft-quoted U3, rose from 7.4% to 7.8%.
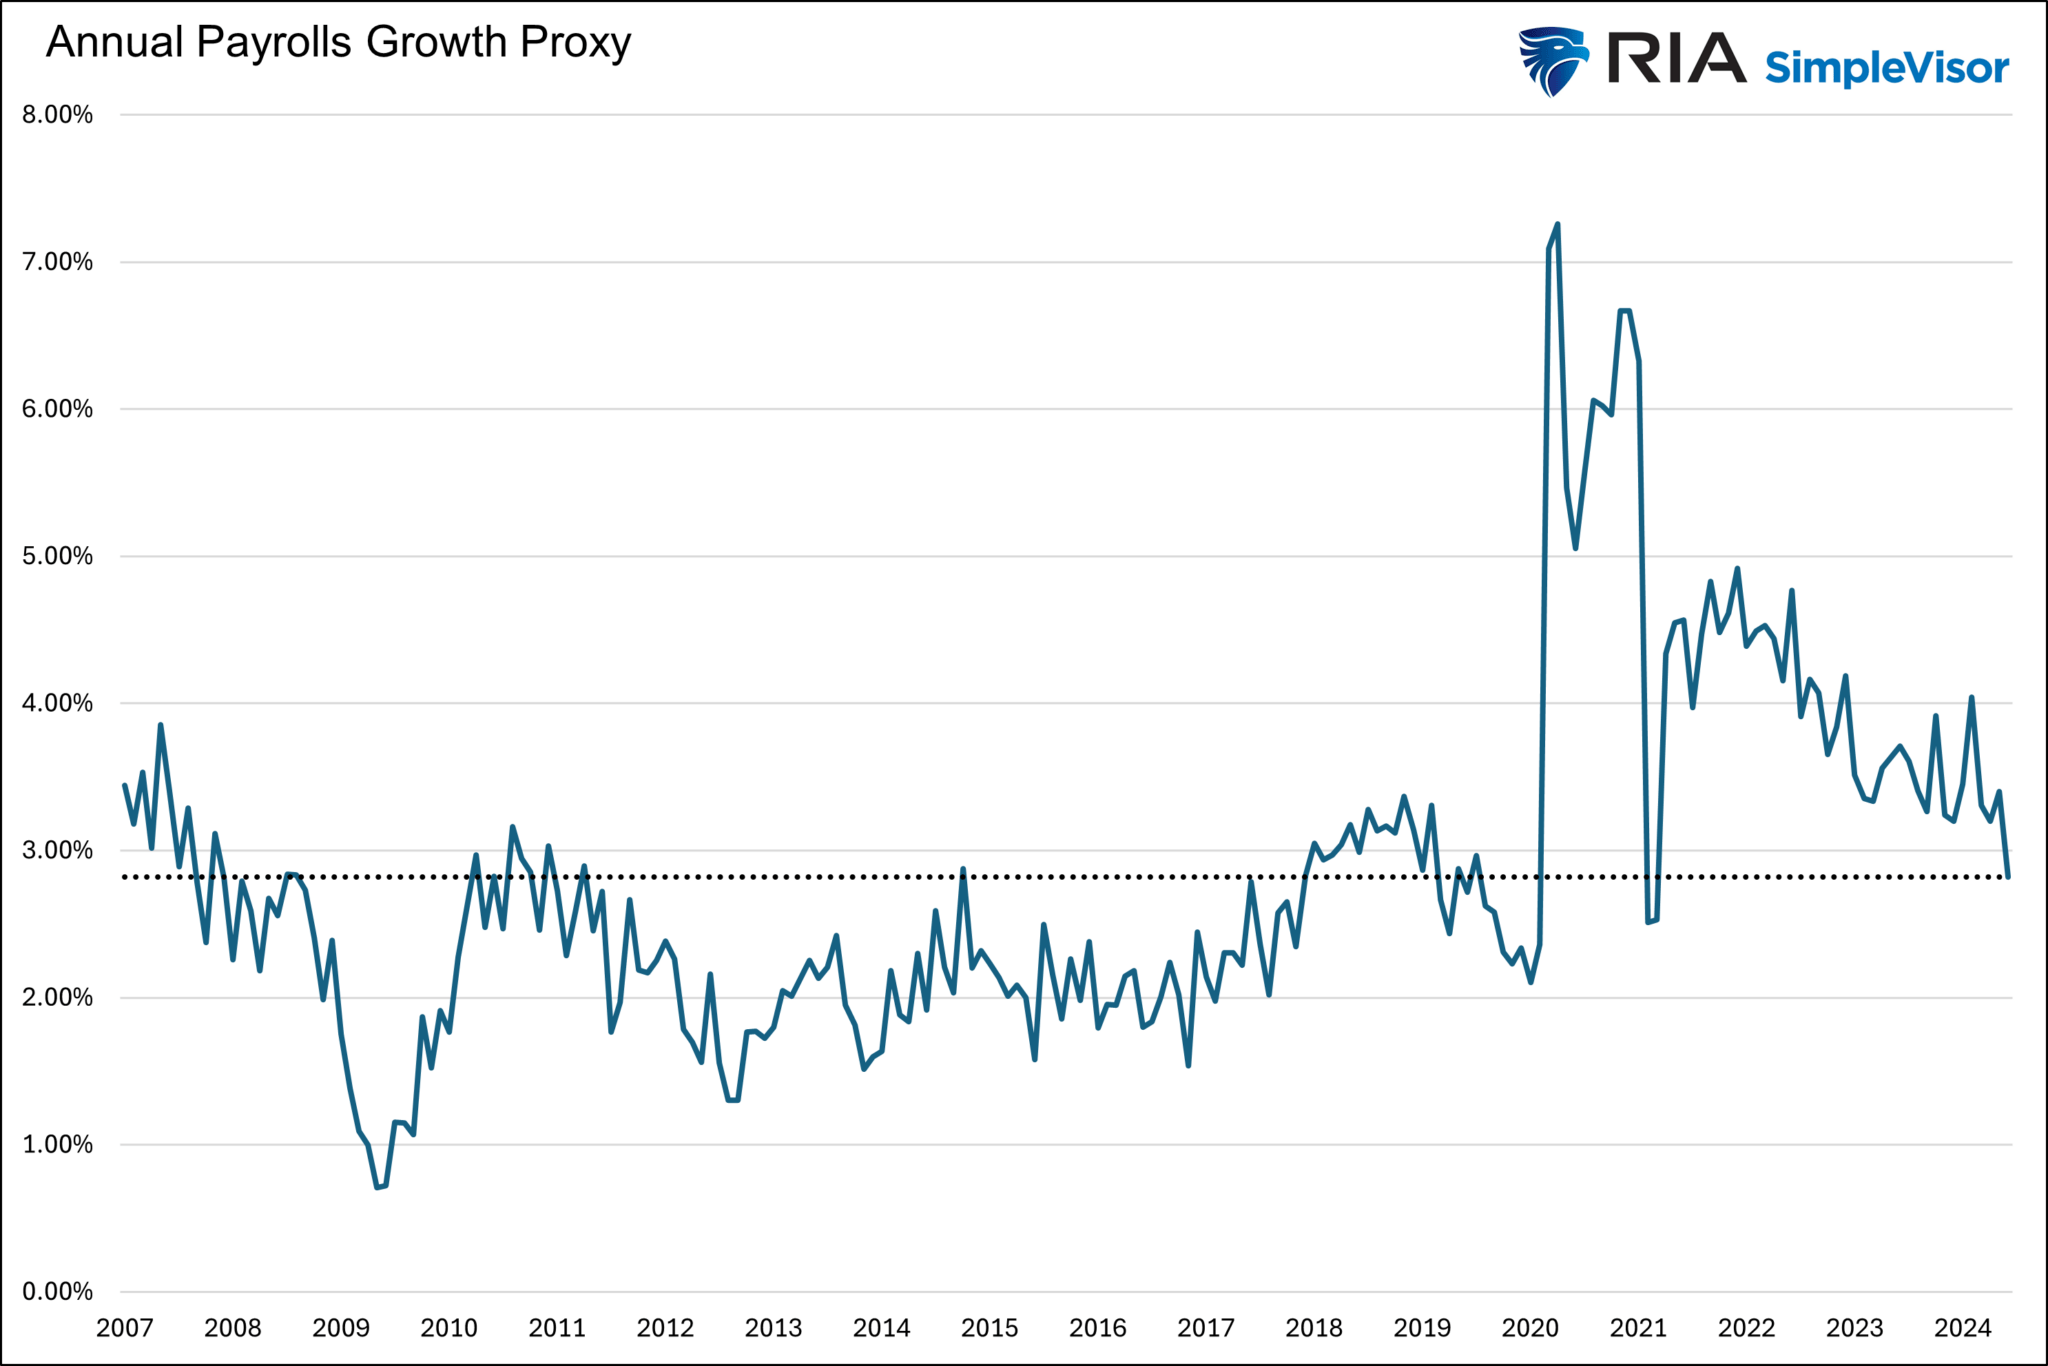
The first graph below shows the annual growth of average hourly earnings times average weekly hours. This proxy for average yearly salaries shows that the current growth rate is back to pre-pandemic levels. The three-month growth rate is equal to the 2012-2019 average. Is it any wonder Powell said the labor market is back to where it was on the eve of the pandemic?
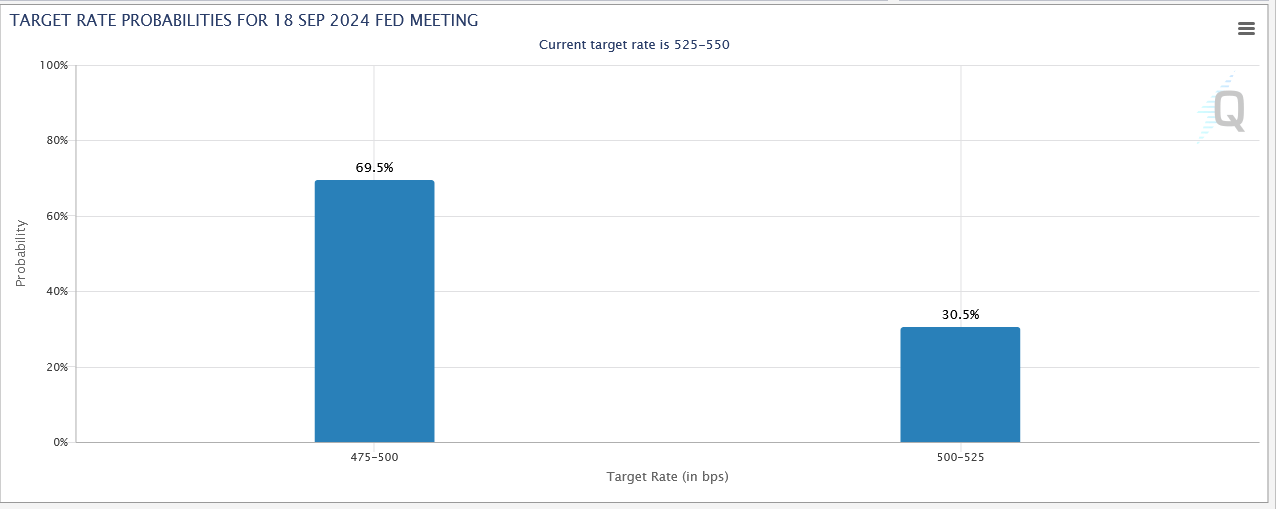
The Fed Funds futures markets now imply a 70% chance the Fed will cut rates by 50bps at the September 18 meeting. Furthermore, the market is now pricing 100 to 125bps of rate cuts by year-end. Given Powell’s statements last week, seeing the market aggressively pricing in rate cuts on the heels of the BLS report is unsurprising.
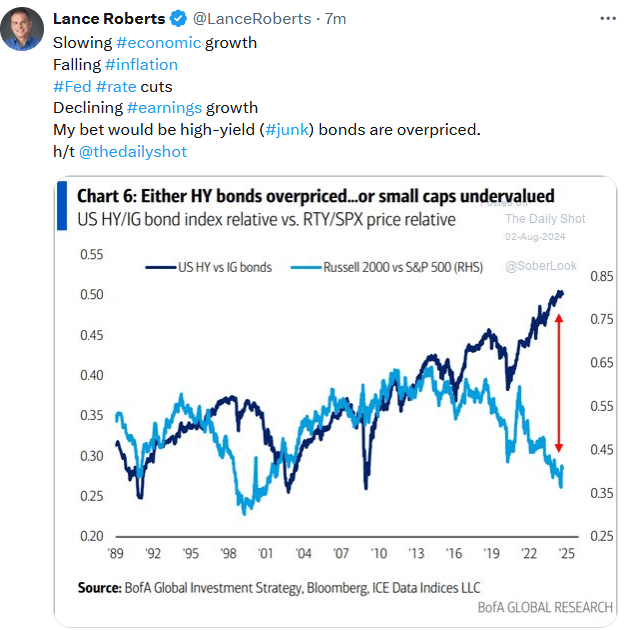
Tweet of the Day
More By This Author:
Yield Curve Inversions Starting To Uninvert
The Sahm Rule, Employment, And Recession Indicators
A Fed Cut In September Nears Certainty


Comments
Log in or sign up to join the conversation.