
Coal miners used to bring canaries into the mines to protect themselves from harmful gases. The canary will keel over if the gas levels increase, giving the miners time to exit before meeting the same fate. In the same vein, no pun intended, there is a corporate bond credit spread that can serve as an economic canary.
Corporate credit spreads, or the difference between a bond’s yield and Treasury yields, measure the perceived risk of default. Thus, the higher the spread, the greater the premium investors demand to insure against default. From AAA to junk-rated credit, spreads are historically tight. Thus, investors are not overly concerned about economic weakness, which usually precedes defaults. However, a closer inspection of credit spreads by ratings exposes a bit of a warning.
Our canary is the difference between the highest-rated junk bonds, BB, and the junk bonds closest to default, CCC. As shown, CCC bond spreads have been rising. However, BB spreads continue to drift lower. The increased spread between BB and CCC is only minor. In other words, the canary just coughed. Let’s watch the canary to see if its condition worsens.

What To Watch Today
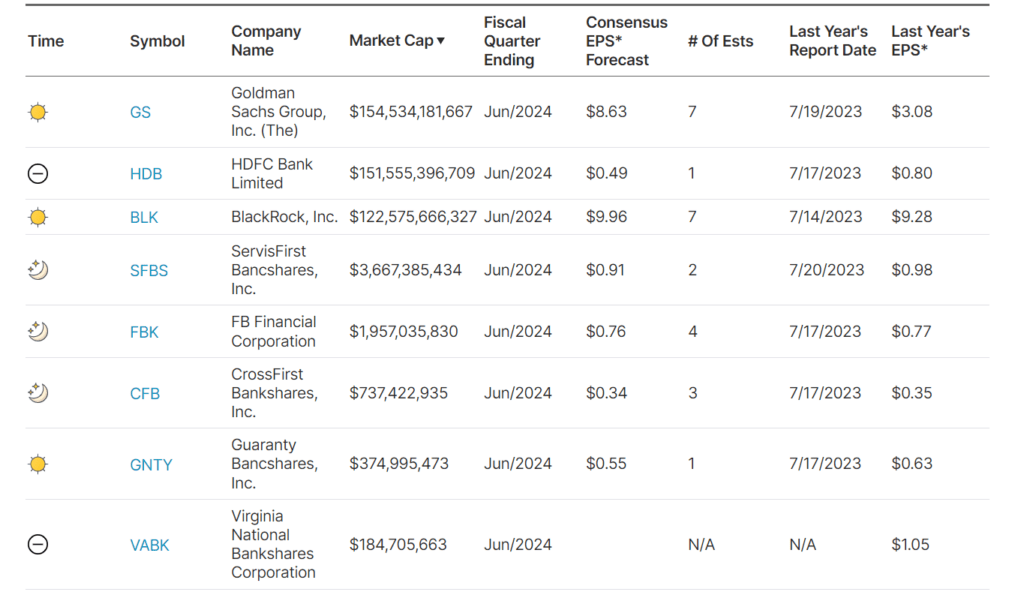
Earnings
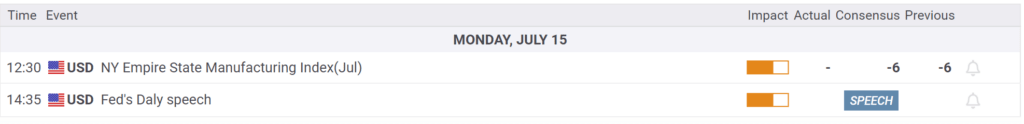
Economy
Market Trading Update
As noted on Friday,
“The rally that began in late October is one of the longest rallies in history. The chart below shows the 37-week rate of change for the S&P 500 index. While there have certainly been periods with larger percentage gains, the current change exceeds 30%, which has historically preceded corrections and consolidations. Conversely, 20% or greater reversions have been decent buying opportunities for investors. The shaded periods show the buying and selling opportunities that have not been that numerous since 1964.”
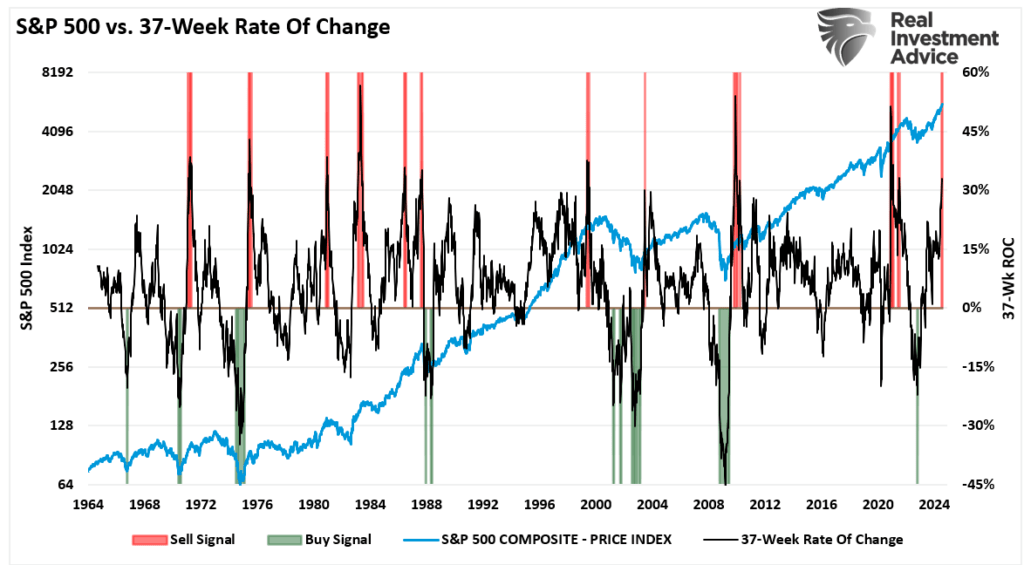
As discussed last week, the market did indeed flip that “sell signal,” pushing higher and topping 5600 for the first time. However, it also pushed the market back into extremely overbought territory, and the deviation from the 50-DMA is quite significant. Such suggests that, as we saw in late May and June, the market will either consolidate or correct back to the 20-DMA. If the bulls can hold that level again, as they have, the market could continue to push higher. Such is possible given the current exuberance surrounding the Fed cutting rates. However, if the 20-DMA fails, as in early April, the 50-DMA becomes the next logical support, with the 100-DMA close behind. Such would encompass another 3-5% correction.

With the market continuing its “non-stop” advance, the bulls have become emboldened to take on more risk and are unconcerned about the risk of a correction. Such often does not end well, but as Warren Buffett once quipped:
“The markets are a lot like sex; it feels best just before the end.”
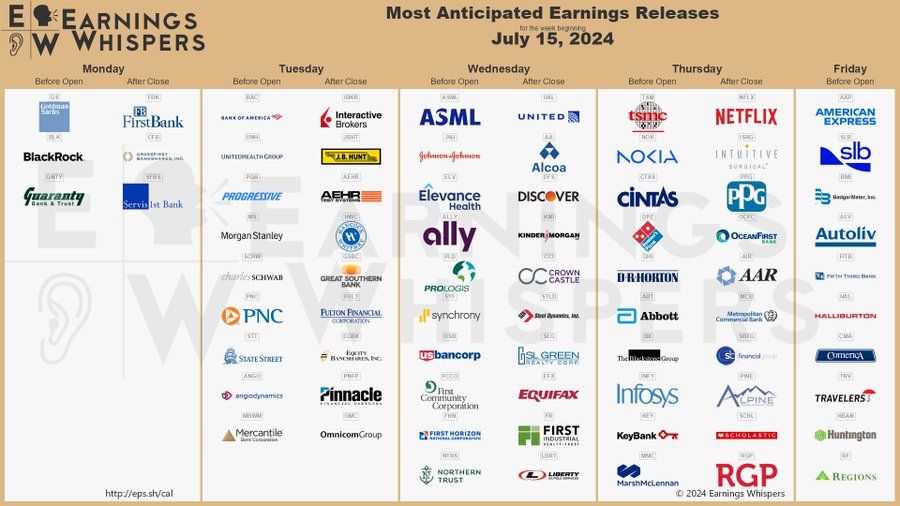
The Week Ahead
With inflation and the unemployment reports in the rearview mirror, corporate earnings will take center stage. Leading the list are Goldman Sachs, Bank America, United Healthcare, J&J, Netflix, and American Express. We will be watching to see if companies can maintain higher-than-average profit margins despite normalizing inflation. Furthermore, companies like J&J, American Express, and United will provide insight into personal consumption.
Jerome Powell will speak again today. He may opine on the latest inflation data and how that affects the Fed’s outlook. Also on the calendar is Retail Sales on Tuesday.
Bizarro Stocks
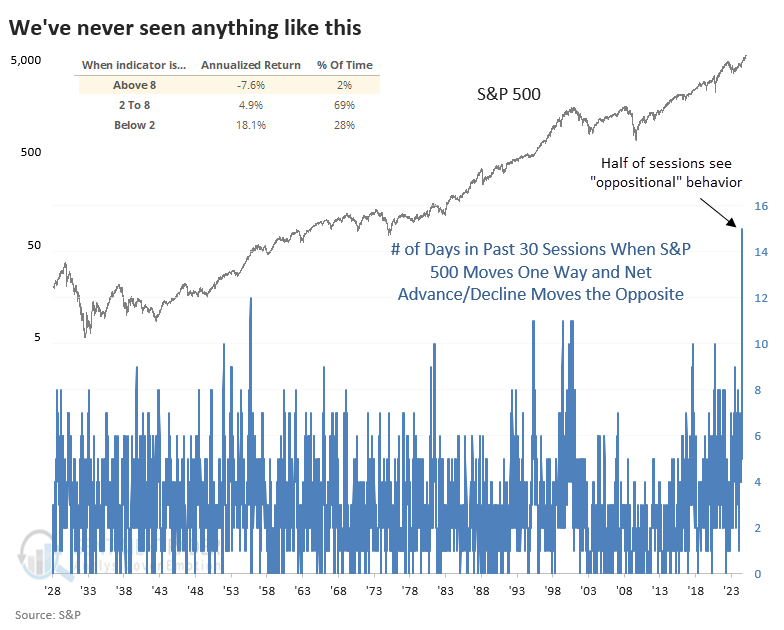
Sentimentrader shared the graph below, showing that fifteen of the last thirty days have seen the S&P 500 index move in the opposite direction as the advance-decline line. The next closest instance, going back to 1928, is 12 days. The table on the top left shows that prior instances when the number of occurrences was above eight were followed by an average annualized return of -7.6%. Furthermore, about 40% of stocks in the S&P 500 are down this year despite the index being up nearly 20%.
Bizzaro stats like these and many others attest to the heavy contribution of large-cap stocks to index returns and how they mask underlying market weakness. The top 30 stocks account for over half of the index. Moreover, Microsoft, Apple, Nvidia, and Amazon account for 25% of the total.
Tweet of the Day

More By This Author:
Put Option Hate & The Need For InsurancePrices Decline Raising The Odds Of A Rate Cut
The “Broken Clock” Fallacy & The Art Of Contrarianism


Comments
Log in or sign up to join the conversation.