Are Imports A Leading Or Contemporaneous Indicator Of Recession?
Answer: Yes, and (to a lesser extent) Yes.
Consider the current situation.
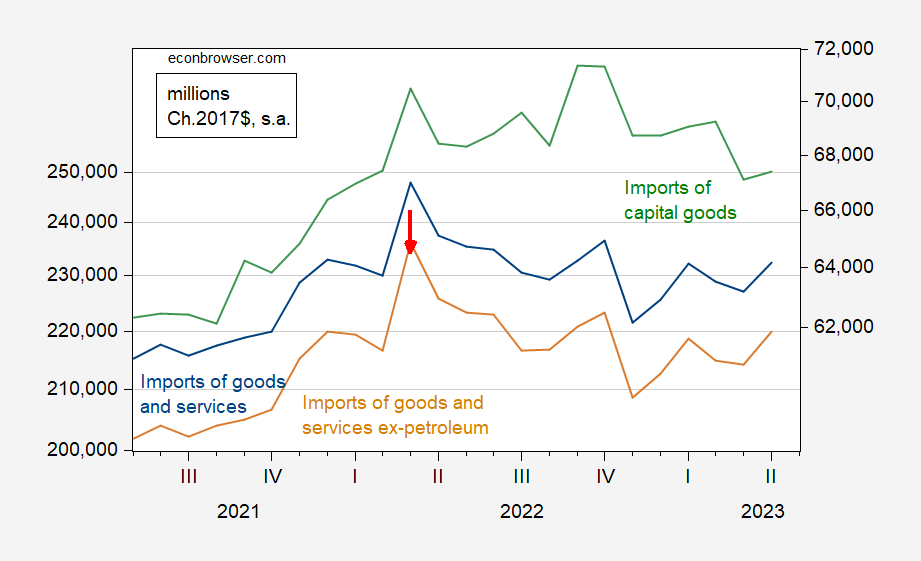
Figure 1: Imports of goods and services (blue), imports of goods and services ex-petroleum (tan), imports of capital goods (green, right scale), all in miilions of Ch.2017$. Source: BEA.
Real imports of goods and services excluding petroleum peaked in March of 2022. They, and total imports, remain below those levels. Capital goods imports — which should reflect more forward-looking behavior — peaked in September of 2022.
Real imports did peak before the recession of 2001.
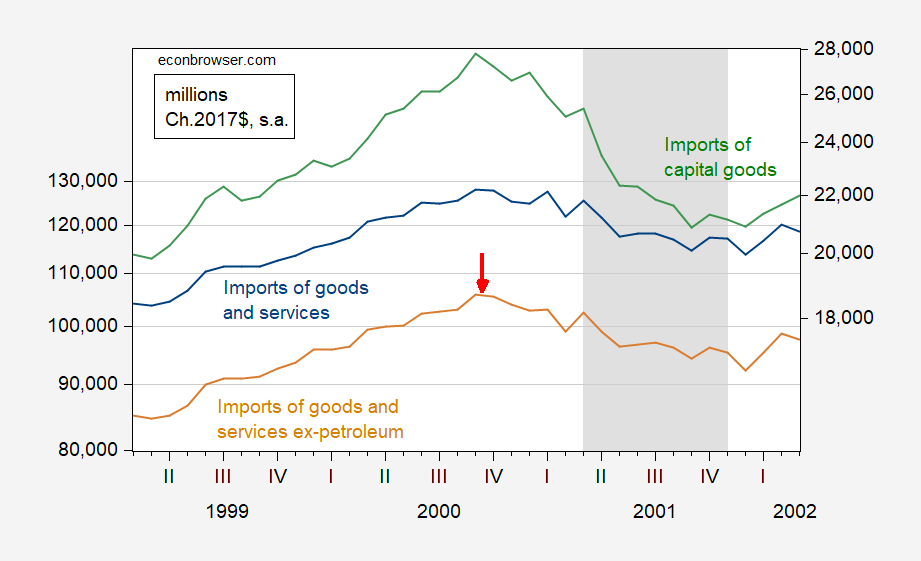
Figure 2: Imports of goods and services (blue), imports of goods and services ex-petroleum (tan), imports of capital goods (green, right scale), all in miilions of Ch.2017$. NBER defined peak-to-trough recession dates shaded gray. Source: BEA, NBER.
On the other hand, while imports ex-petroleum peaked in March 2007 (actually technically peaked slightly higher in February 2008), capital goods peaked in April of 2008, months into the recession as defined by NBER.
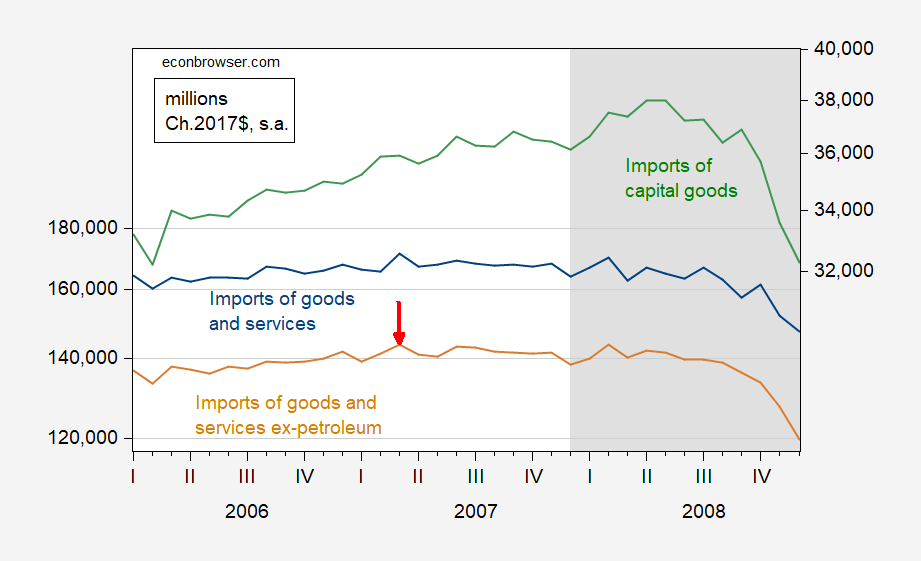
Figure 3: Imports of goods and services (blue), imports of goods and services ex-petroleum (tan), imports of capital goods (green, right scale), all in miilions of Ch.2017$. NBER defined peak-to-trough recession dates shaded gray. Source: BEA, NBER.
Finally, in the last recession, imports ex-petroleum peaked in December of 2018. And capital goods imports actually peaked in September of that year.
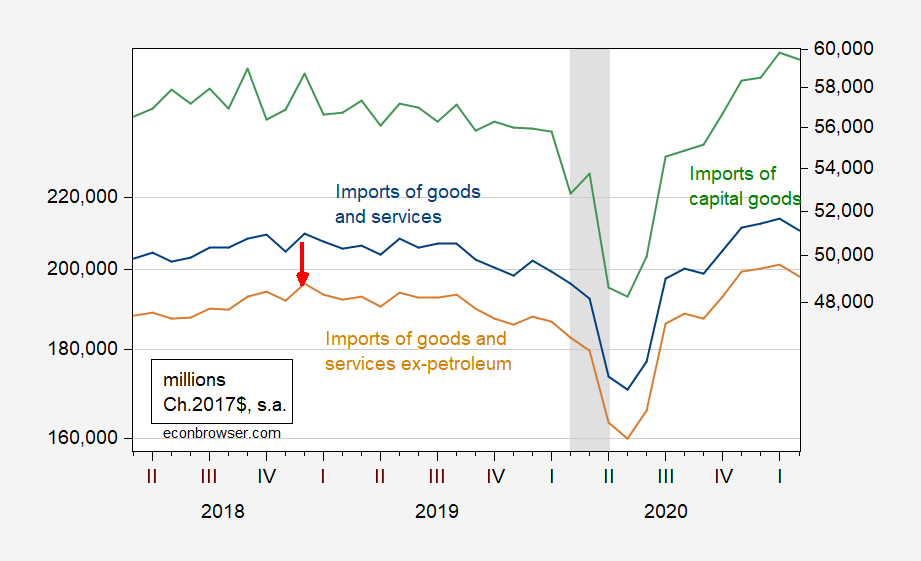
Figure 4: Imports of goods and services (blue), imports of goods and services ex-petroleum (tan), imports of capital goods (green, right scale), all in miilions of Ch.2017$. NBER defined peak-to-trough recession dates shaded gray. Source: BEA, NBER.
Hence, aggregate real imports are typically a relatively reliable precursor of recessions (subcategories like capital goods are not necessarily so), at least for the last three recessions. What about false positives — i.e., cases where imports fell but no recession occurred. One wants to consider cases where an extended period of flat or declining imports occurred, like half a year. On quick inspection, it looks like there’s only one such case — March 2015, when it took a subsequent 2.5 years to regain that level. No recession as defined by NBER occurred then, but as many have noted, there was a manufacturing slump starting in 2014M12, induced by dollar appreciation.
This set of finding suggests that, had no pandemic struck, the US might well have entered a recession nonetheless. Below is a picture of key NBER series, using real-time data (i.e., data as they were reported as of March 1, 2023) (from this post).
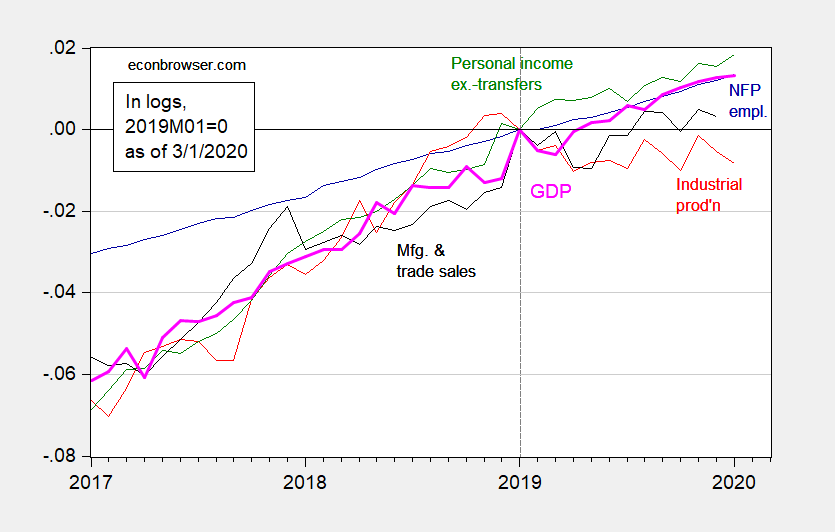
Figure 5: Nonfarm payroll employment (blue), industrial production (red), personal income excluding transfers in Ch.2012$ (green), manufacturing and trade sales in Ch.2012$ (black), and monthly GDP in Ch.2012$ (pink), all log normalized to 2019M01=0.Source: BLS, Federal Reserve, BEA, via FRED, Macroeconomic Advisers (2/28 release), and author’s calculations.
Notice industrial production and manufacturing and trade industry sales were trending sideways. The belief that a recession was imminent was consistent with my views laid out in a January 2019 post, noting the near inversion of the yield curve.
More By This Author:
SIFMA Semiannual Survey – The Outlook For GrowthWhy Consumption Has Been Sustained
The Budget Balance To GDP Ratio: Actual & Cyclically Adjusted


