

Reader Bruce Hall argues that “With the exception of travel related and luxury related items, the monthly adjustments[to the CPI] tend to be relatively minor…”. I beg to differ.
Here is the CPI seasonal component:
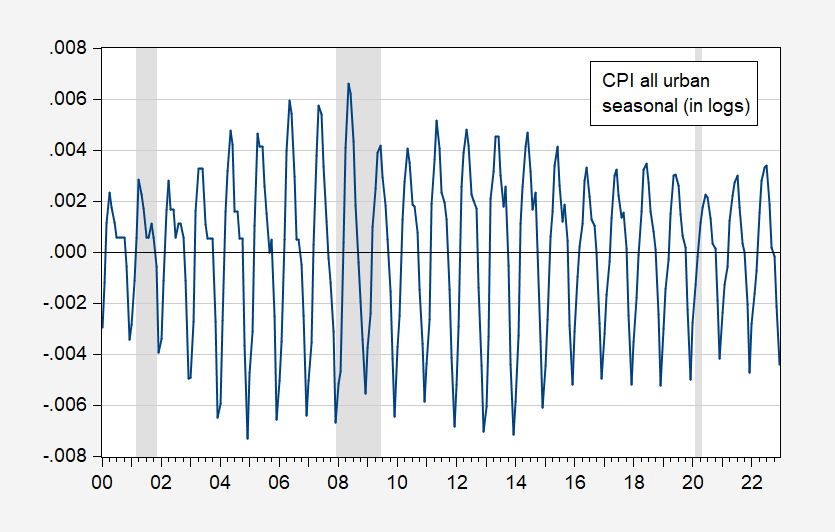
Figure 1: Log ratio nsa CPI all urban to sa CPI (blue). NBER defined peak-to-trough recession dates shaded gray. nsa CPI is FRED series CPIAUCNS, sa CPI is FRED series CPIAUCSL. Source: BLS via FRED, NBER and author’s calculations.
In July 2022, the unadjusted CPI looks one-third of a percentage point higher than the adjusted. Is that “minor”? I don’t think so.
Does converting to growth rates fix things? Only if one does a 12 month difference (note: that won’t work for Chinese data, where the lunar new — tomorrow for 2023 — moves from January to February and back). Below is the seasonal component in the month-on-month annualized CPI all urban inflation.
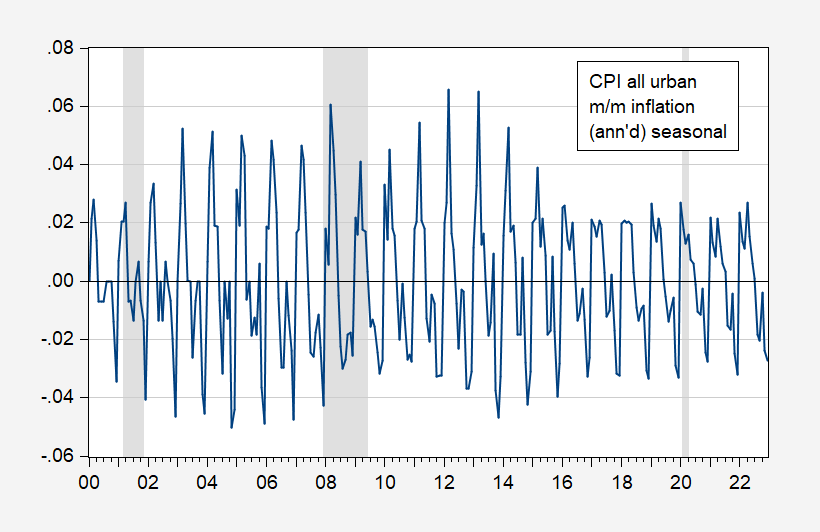
Figure 2: First difference of log ratio nsa CPI all urban to sa CPI (blue). NBER defined peak-to-trough recession dates shaded gray. nsa CPI is FRED series CPIAUCNS, sa CPI is FRED series CPIAUCSL. Source: BLS via FRED, NBER and author’s calculations.
In April 2022, annualized month-on-month inflation looks like 2.7 percentage points higher using unadjusted data than what it looks like using adjusted data. Is that “minor”? I don’t think so.
How about Core CPI?
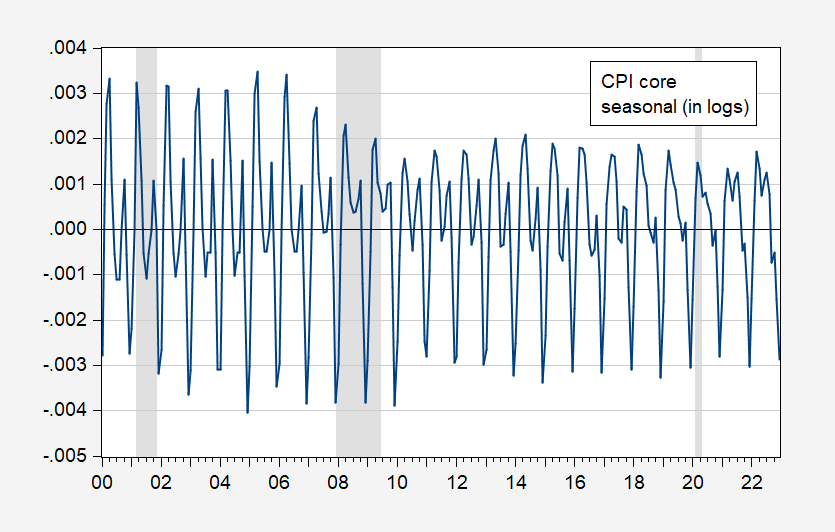
Figure 3: Log ratio nsa core CPI all urban to sa core CPI (blue). NBER defined peak-to-trough recession dates shaded gray. nsa CPI is FRED series CPILFENS, sa CPI is FRED series CPILFESL. Source: BLS via FRED, NBER and author’s calculations.
Up until the Great Recession, seasonals were about a third of a percentage point. Now they’re around a sixth.
And about nonfarm payroll employment.
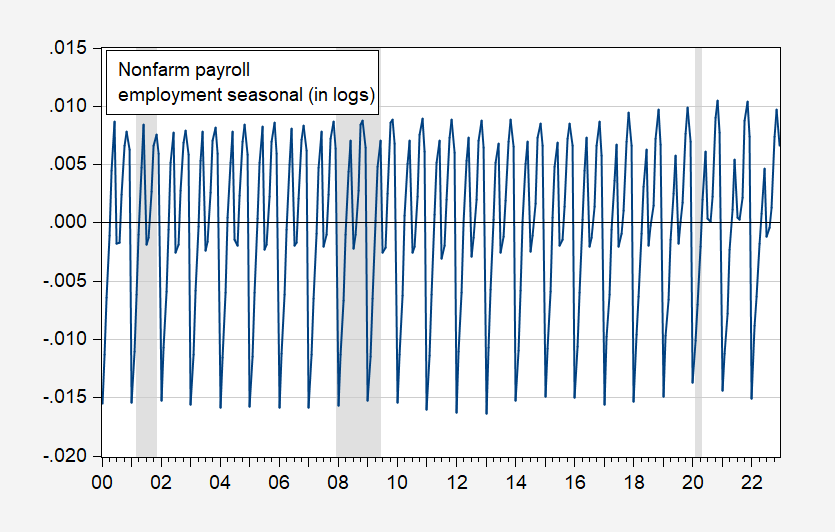
Figure 4: Log ratio nsa nonfarm payroll employment to sa employment (blue). NBER defined peak-to-trough recession dates shaded gray. nsa nonfarm payroll is FRED series PAYNSA, sa is FRED series PAYEMS. Source: BLS via FRED, NBER and author’s calculations.
Unadjusted nonfarm payroll is nearly a percentage point higher than adjusted. I think we all agree that is not “minor”.
More By This Author:
Why Friends Don’t Let Friends Calculate 18 Month Not-Seasonally Adjusted Growth Rates
"Beneath The Stock Market's Surface ... "
Business Cycle Indicators As Of Mid-January 2023


Comments
Log in or sign up to join the conversation.