
What Your Charts Aren’t Telling You And How It Affects Backtesting And Strategy Performance
Looking at stock, forex, or futures charts often make it seem easy to make money. Yet many traders and investors do not watch price action in real-time, rather they only see a five-minute, hourly, or daily chart in hindsight. While seeing a chart in hindsight is useful, it only shows a few data points, not everything that happened during that period.
Common trading charts such as OHLC (Open, High, Low, Close) and Candlestick charts lose information as the time period comes to an end. As the price bar is forming, it moves with every transaction (or on forex charts, every time the bid changes). But at the end of the period, you only see the open, high, low, and close prices.
Traders who don’t realize there’s an information loss may have a hard implementing a strategy in real-time when they have only backtested on completed candles. Or their strategy may significantly underperform in live testing compared to backtesting.
How do I know this? Because I place trades in real-time and occasionally get stopped out of trades that based on the chart (after the fact) can make it look like easy money.
OHLC and Candlestick Charts Lose Information As They Form
Charts provide summary data for a period, not a detailed breakdown of what happened during that period. When a bar is shown, most of the price data that occurred during that time frame is gone. Only the open, high, low, and close are left to tell of that time period.
In hindsight, a candle can make it look like the price went straight from its opening to close, when in fact there may have been many gyrating movements between the opening and close in that time.
The lost information may contain false breakouts, rapid back-and-forth movements, or any combination of movements that are contained within the high, open, close, and low of the bar.
Below is an hourly chart of BP (BP). On the hourly chart, it may appear as if the market broke below 39.39 and proceeded to make a low at 39.21 (2nd last red candle) before recovering in the next hour (the last candle). Since we’re looking at a bar we assume the prices happen in a logical chronological order: in this case, open, high, low then close. The reality could be very different.
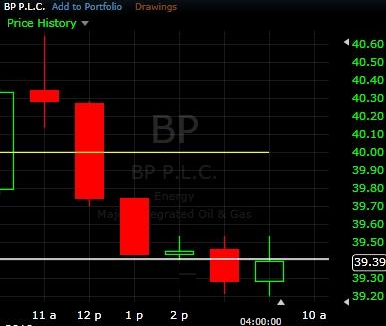
To a trader running visual back tests, they may inadequately account for the fact that instead of moving through 39.39 and proceeding to 39.21 directly, the price action could in fact be much choppier. The one-minute chart below shows the price dropping below and then moving up through 39.39 multiple times before making a low at 39.21.
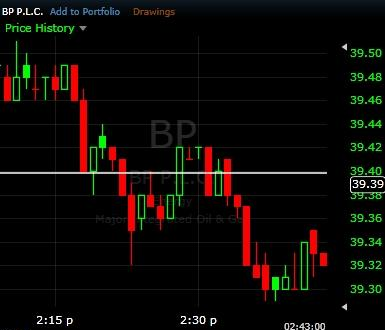
These small movements may not seem significant, but depending on the trading system and stop losses employed, one true breakout (breaks through and doesn’t come back before the price target is reached) is very different from movement that fluctuates in a choppy fashion around the breakout price.
The following chart shows a possible short entry signal (arrow) for a strategy when the price drops below the green bar…it could be a daily, hourly, or 1-minute chart, it doesn’t matter.

This looks like a good entry. The price pulled back a little bit after the entry and then dropped again.
That’s actually not how it unfolded. On the red bar with that arrow, the price dropped below the green candle, then went all the way back up hitting any stop loss that was within that prior green candle. Then the price dropped below the green candle low (again), went all the way back up to the red candle high, and then dropped back to the low of the candle near the end of the candle time frame.
If a trader placed a stop loss near the top of the green candle, they could have been stopped out twice before the price finally dropped away into profitability.
Now, you may say “I wouldn’t place a stop loss there!” or “I wouldn’t enter while a candle is still forming!” and that is all well and good. But it doesn’t change the fact that when you look at charts you don’t get the whole story of what happened during candles, and unless you are only placing trades based on closing prices, at some point this phenomenon will affect your trades.
The chart below looks at some “easy money trades” based on entering short on the red bars when the price drops below the low of the green candles (these are actual trade triggers I use in my strategies).

If you assume chronological order based on the direction of the candle, these trades look easy. But we don’t know the order of things.
In fact, on both these trades, the price dropped below the low of the prior candle, then rallied back above the high of the prior candle, and then dropped again to make the candle red when it closed.
If a stop loss was placed at the top of the green candle prior, these trades would have been stopped out and would have had to be re-entered to catch the ensuing drop. Without knowing what happened in real-time, a trader could have gotten whipsawed multiple times, not just once at each entry point.
Again, this may not be your strategy, but unless you ONLY act on price bars that have closed, this will happen in real time and it isn’t always noticeable on the chart. Trading on the close is also tricky because then you either need to enter right at the close without knowing what it will be, or enter at the next open which may give a different price than the close or not get you into the trade if the price moves quickly away from the prior close.
The Negative Effects of Relying on Historical Chart Data
Much research and analysis are done on historical charts. Backtesting is often done using completed bars (see other options in the section below). But since there’s a lot of price movement within bars, several problems often develop which affect actual live trading results:
- A trader may be stopped out of a position continually and wonder why the strategy worked well during the backtest. The price then moves in their favor. The strategy may work well, but it hasn’t accounted for the price movement within price bars. They are stopped out of the trade before the move they are trying to capture (and backtested for) happens.
- In real-time the prices (entry and exit) expected may be hard to get. Prices can move quickly. There may be slippage that isn’t accounted for. The candle, showing summary data, doesn’t reveal if there were gaps in liquidity. Theoretically, one trade could have occurred at the open, high, low, a close, with no other transaction occurring at other prices within the candle. But after the close of the candle, people assume there were transactions at nearly every price within the candle. That may be the case, or may not be.
- When a position is taken in real-time, there may be a lot of price fluctuation the trader does not expect because often completed bars make it appear a stock only moved in one direction. Seeing the price bounce around after entry, and seeing the position initially seesaw between loss and profit is not something that can be experienced on a historical chart. Psychological factors such as fear or greed kick in which may cause a deviation from the strategy.
- If a bar shows up movement (close higher than open) it does not mean the low occurred before the high (the candle wicks). Visually we want to see things in chronological order and assume that the information we view is in this order. It is quite possible in the markets that what is visually logical did not occur that way in real-time. We only know the close occurred after the opening, but we don’t know whether the high or low occurred first. We can’t assume to know unless you actually know.
Strategizing Using Historical Chart Data (with its limitations)
If you are backtesting with a computer or software, download the actual tick data for a period of time and run the backtest on the tick data, not summary chart data (one minute, 5 minutes, etc).
Tick data takes into account every transaction, not just the open, close, high, and low of a candle. It will tell you how many times you get stopped out (or not) and how often the price hits the price target.
If we are backtesting manually, by going through historical charts ourselves (I only manually backtest), then we need to keep a few things in mind.
- Remember that any time we could have taken a trade while a bar is forming, we don’t know the order of events that occurred. Therefore, assume the stop loss would need to be outside the entire range of the candle that is forming while we are taking a trade. If it is anywhere within the range of the trigger candle, it is possible that it could be hit within that candle. Account for this.
- Unless you study the volume and liquidity of an asset (such as its bid-ask spread) you don’t truly know if you can get in at the price you expect. You may need to account for some slippage, or missing some trades because the price runs too quickly to fill your order at a specific price.
- Consider that in real trading, especially with day trading, you will likely be sitting there watching this trade unfold after you are in it. When we glance at charts there is no sense of time. But in a trade, there is, and it can cause us to question our trades. Consider that for each price bar once the trade is open you will have to sit through (or set your orders and walk away). Is the strategy still viable if you need to sit through or manage the trade while the move you are trying to capture unfolds in actual time?
- Be meticulous when you go through historical charts. Especially if you’re adding up profits and losses from prior trade setups. If it looks like the price may have pulled back to your stop loss location, assume it did, or drop to a lower time frame to find out. Better to have a strategy that performs well when you assumed the worst than to assume the best and have it perform worse in real-time.
- If it is possible an entry and stop loss could have triggered multiple times, consider that, or drop to a lower time frame to find out. If unsure, you need to modify the trade trigger a little bit on all the trades to avoid confusion. But understand, that nothing will ever replace live trading with real-time data. That is where the money is made, and that is where we need to perform.
Above all avoid the idea that prices move in one direction even when a bar makes it appear so. Almost always there is a back-and-forth movement in prices. While occasionally large moves do occur in one direction, it is highly improbable to assume this will occur right when you enter a trade most of the time.
When you start out trading, especially if you are “quick on the trigger” you will have lots of trades that stop you before the price moves in the direction you want.
It will feel like you get stopped out instantly only to watch the price move in your favor shortly after (without you). This is what this article is about. It looks easy on the historical charts. But you need to learn to be selective and decerning in what trades you take. You need to be patient to wait for the correct price triggers, and that means not jumping the gun. This takes time to learn because most new traders are afraid of missing a good opportunity… so they take too many of them…including lots of bad opportunities.
When they look back at their chart they wonder how they could have messed it up! The price moves look clear and easy to capture, but they lost a bunch of money instead. The chart is hiding something, and the impulsive trader is getting screwed by it. Hopefully, now you know why this is happening, even though you studied lots of historical charts.
If the price is moving in your expected direction after many of your trades, but you’re not onboard because you got stopped out, oftentimes just a tiny bit of patience is all that is required to nail the timing.
More By This Author:
Swing Trading Stock Market Outlook For The Week Of Sept. 19Swing Trading Stock Market Outlook For The Week Of Sept. 12
Swing Trading Stock Watchlist for Week of September 12
Disclaimer: Nothing in this article is personal investment advice, or advice to buy or sell anything. Trading is risky and can result in substantial losses, even more than deposited if using ...
more

