
It is hardly news to anyone that the S&P 500 Index (SPX) delivered a rather disappointing performance in 2022. In fact, 2022 was the first time in over one hundred years that both stocks and bonds delivered a negative return. As we can see here, the S&P 500 Index is down 16.23% over the trailing twelve-month period:
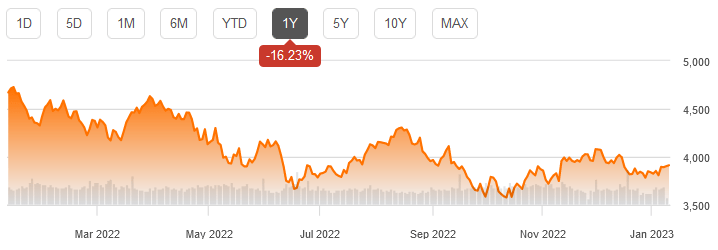
Source: Seeking Alpha
While it has rebounded a bit during the last few trading sessions, it remains far below its levels last January. As a result, there may be some readers that immediately question how I can call the S&P 500 Index expensive.
S&P 500 Valuation Metrics
Let us begin by taking a look at a few valuation metrics for the S&P 500 Index. One of these is the forward price-to-earnings ratio. I am fairly certain that everyone is familiar with the price-to-earnings ratio. In short, it tells the investor how much they have to pay for each dollar of earnings that the company produces. The forward price-to-earnings ratio works exactly the same way except that it tells an investor how much they have to pay for each dollar of earnings that the company is expected to produce over the next year.
As of the time of writing, the S&P 500 Index has a forward price-to-earnings ratio of 19.03. This is a much lower ratio than the 33.06 ratio that the market had at the end of the first quarter of 2021 but it is still a bit higher than the 18.65 ratio that the index had at the end of the second quarter of 2021:
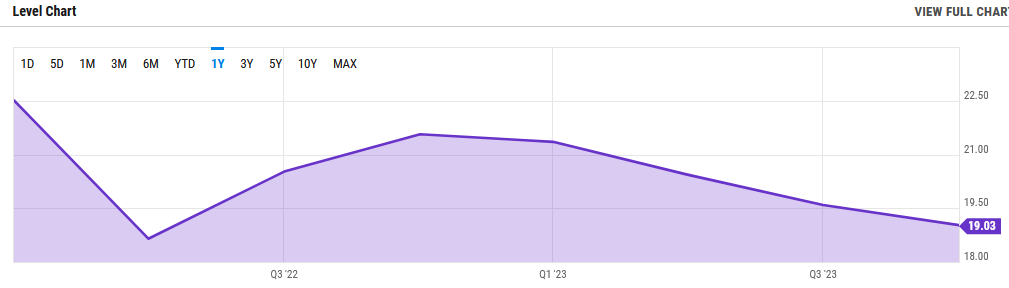
Source: YCharts
Historically, the S&P 500 Index has had an average price-to-earnings ratio of 18-22 using data going back to 1900. Thus, the index is currently trading in its average range. At first glance, that does not seem particularly expensive. However, it is important to keep in mind that during any sort of weak economy, the index declines to a level that is well below the average. The economy is widely expected to enter into a recession sometime in 2023 but the Federal Reserve is showing no signs of stopping its rate hikes to prevent this. In fact, Chairman Powell has hinted that the central bank is actually attempting to tip the economy into a recession in order to stop inflation. Thus, the market has almost certainly not bottomed out since it is still trading at a historically fair valuation. We can expect some more downside before we ever see the market return to its 2021 highs.
Another valuation metric that we can use for the market is the total market cap-to-gross domestic product ratio. This is a ratio that we do not often hear about even though famed investor Warren Buffett has stated that it is "probably the best single measure of where valuations stand at any given moment."
As of today, the total market index stands at $38.8207 trillion. That is the total market capitalization of all publicly-traded American companies. It is also 150.9% of the American gross domestic product. That is, to put it mildly, well above its historical average:
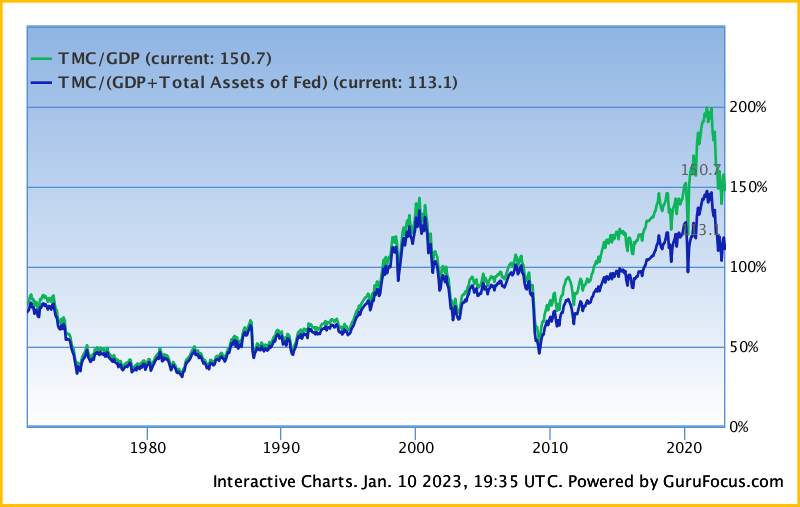
Source: GuruFocus.com
While the ratio is admittedly not at its all-time high, we can see that it is still well above the historical average of 100%. This ratio tends to mean-revert over time, which means that it will tend to gravitate to 100% over the long term. It would also likely overshoot to the downside during a poor economy, such as what happened back in the last financial crisis. Thus, we can conclude that some downside from today's levels is a very likely outcome.
Not All Sectors Are Richly Valued
With that said, not every sector in the economy is richly valued. As I have pointed out numerous times across various sites, the traditional energy sector looks quite cheap.
I am certain that some readers may instantly see that statement and object. After all, energy was by far the best-performing sector over the past year. In fact, the iShares U.S. Energy ETF (IYE) is up a remarkable 41.98% over the past twelve months:
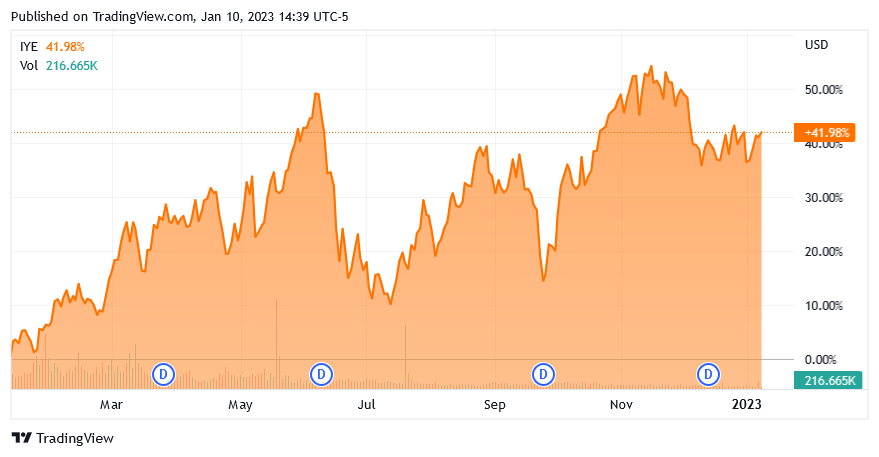
Source: Seeking Alpha
The reason for that is pretty obvious - energy prices shot up. However, just because the stocks of pretty much every company in the industry shot up does not mean that the companies are overvalued.
We can see this by looking at the forward price-to-earnings ratios of several energy companies:
| Company | Forward P/E |
| ExxonMobil (XOM) | 10.41 |
| Chevron (CVX) | 10.78 |
| ConocoPhillips (COP) | 9.46 |
| APA Corporation (APA) | 5.44 |
| Diamondback Energy (FANG) | 5.84 |
| Range Resources (RRC) | 5.50 |
The same ratios can be seen all across the energy sector. As we can clearly see, these companies are all looking incredibly cheap relative to the rest of the S&P 500 Index. In fact, these valuations really only make sense if one believes that these companies will be going out of business in the near future. As I have pointed out in the past, that is highly unlikely to happen despite what environmentalists and politicians are saying.
More By This Author:
US LNG Exports Surge, Why Aren't You Profiting?
Could 2023 Be The Year For Gold?
Remembering 2022 And Opportunities For 2023


Comments
Log in or sign up to join the conversation.