
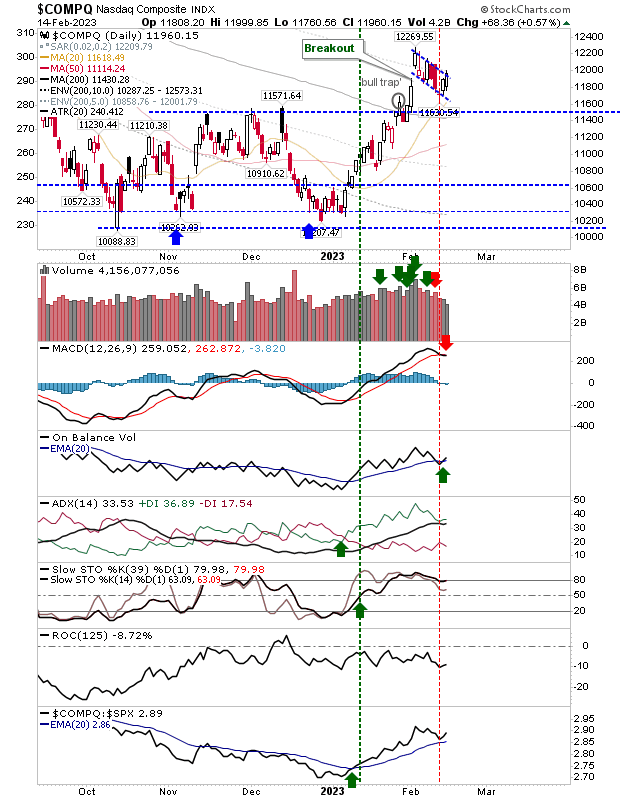
As markets retreat back to support, they do so by building 'bull flags'. This action - if it delivers the expected breakouts - will open up for measured moves higher.
In the case of the Nasdaq, we have a measured move target around 14,000. However, there is a 'sell' trigger in its MACD, but this shouldn't offset the strong relative performance of the index to the S&P.
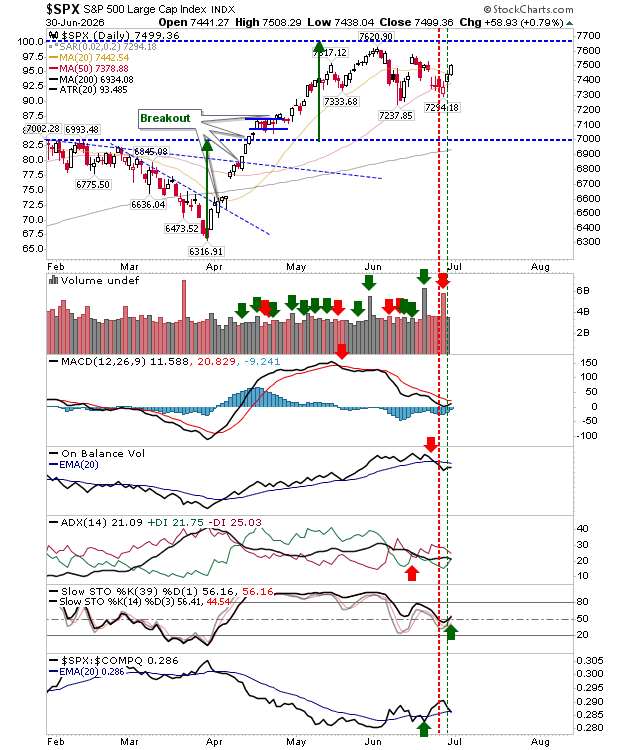
The S&P had already successfully tested breakout support, and its 20-day MA, but now finds itself shaping a 'bull flag' as an added bonus. As with the Nasdaq, I wouldn't be too concerned with the MACD trigger 'buy' as it makes back significant ground against the Russell 2000.

While on the subject of Large Caps indices, the Dow Jones Industrial average is on the verge of a breakout and is probably the best trade for momentum players.

The Russell 2000 (IWM) has the sharpest angled 'bull flag', but it has bounced off support and held on to its 20-day MA. There was a MACD trigger 'sell' to go with a confirmed distribution day. The Russell 2000 is underperforming against the Nasdaq and hasn't yet made up lost ground to this index.

Markets continue to perform well, even in decline. Today's gains brought indices back to 'bull flag' resistance and ready for breakouts, that could come as soon as tomorrow.
More By This Author:
Russell 2000 And S&P 500 Successfully Test Breakout Support
Inside Day Losses
Tentative Steps Lower For Markets


Comments
Log in or sign up to join the conversation.