Macy's Is Turning The Corner

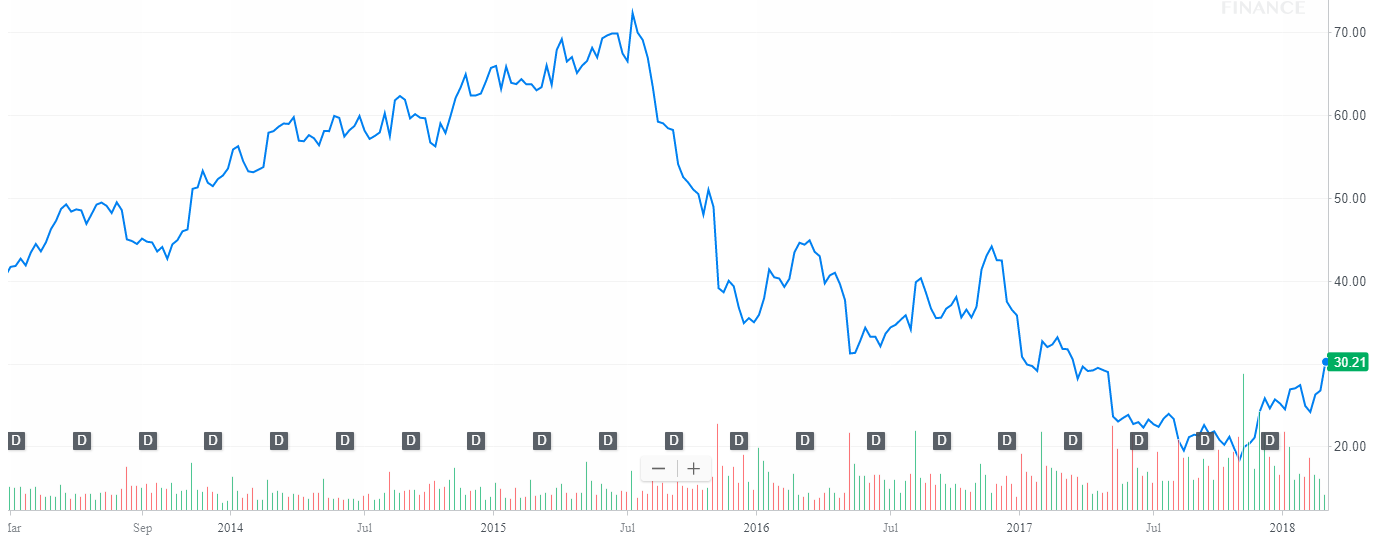
Macy’s (M) is a company that we have been following for several years. We have watched as this one great retail darling has fallen from grace, as sales and earnings have fallen dramatically in the last five years. With the ever-changing consumer, Macy’s was slow to adapt, and its share price suffered in the last five years:

Source: Yahoo Finance
That said, the company seems like it may now finally be turning the corner, but it is not out of the woods yet. In the present column, we discuss the performance of the name, homing in on sales, operating income, cash flows and the bottom line. Further, we offer our projections for 2018.
Top line sales improve—but there was an extra week of business
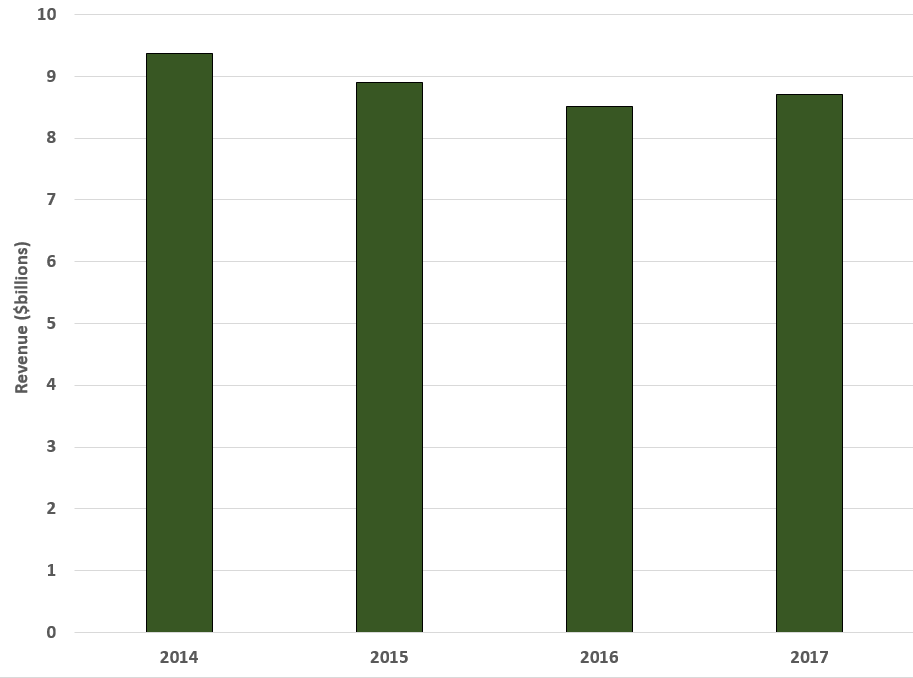
Sales in the fourth quarter of 2017 totaled $8.666 billion, an increase of 1.8 percent, compared with sales of $8.515 billion in the fourth quarter of 2016. As you can see Q4 had seen a disastrous slide in recent years, only to rebound:

Source: SEC filings, chart made in excel by author
So, what drove these results? We were pleased to see that comparable sales improved. On a company store owned basis, sales were up 1.3 percent in the fourth quarter and up 1.4 percent on an owned plus licensed basis. Total sales in the fourth quarter of 2017 reflect a 14th week of sales, so the growth must be taken with a grain of salt. That said, comparable sales were up comparing a 13-week sales period. What about for the year?
Well, sales are still down comparing the fiscal year 2017 versus 2016. Sales in fiscal 2017 totaled $24.837 billion, down 3.7 percent from total sales of $25.778 billion in fiscal 2016. Comparable sales on a company owned basis declined 2.2 percent in fiscal 2017. Comparable sales on an owned plus licensed basis declined by 1.9 percent in fiscal 2017. This is even more painful because total sales for fiscal 2017 reflect a 53rd week of sales, whereas comparable sales are on the same 52-week basis as fiscal 2016. That said, much of the weakness was in the earlier part of the year. What about other metrics?
Operating income grows
Operating income for Q4 totaled $1.213 billion, or 14.0 percent of sales, compared to $815 million, or 9.6 percent of sales, for Q4 2016. Big improvement here. For fiscal 2017, operating income totaled $1.807 billion, or 7.3 percent of sales, compared with operating income of $1.315 billion, or 5.1 percent of sales, for fiscal 2016.
Cash flows improved on the year
Net cash provided by operating activities was $1.944 billion in fiscal 2017, compared with $1.801 billion in fiscal 2016. Net cash used by investing activities in fiscal 2017 was $373 million, compared with $187 million in fiscal 2016.
Operating cash flows net of investing were $1.571 billion in fiscal 2017, compared with operating cash flows net of investing of $1.614 billion in fiscal 2016.
Here is where we are encouraged. During 2017, improved its balance sheet by using excess cash to reduce its debt and leverage by approximately $950 million. Anything that reduces the debt is welcomed.
The all-important bottom line and our assessment
Fourth quarter 2017 earnings per diluted share were $4.31 compared to $1.54 per share in the fourth quarter of 2016. Fiscal 2017 earnings per diluted share were $5.04 compared to $1.99 per share in fiscal 2016. Much of this was a result of course of tax reform.
That said, when we look on an adjusted basis, Fourth quarter and fiscal 2017 adjusted earnings per diluted share were positively impacted by 7 cents due to the change in the effective annual tax rate due to federal tax reform.
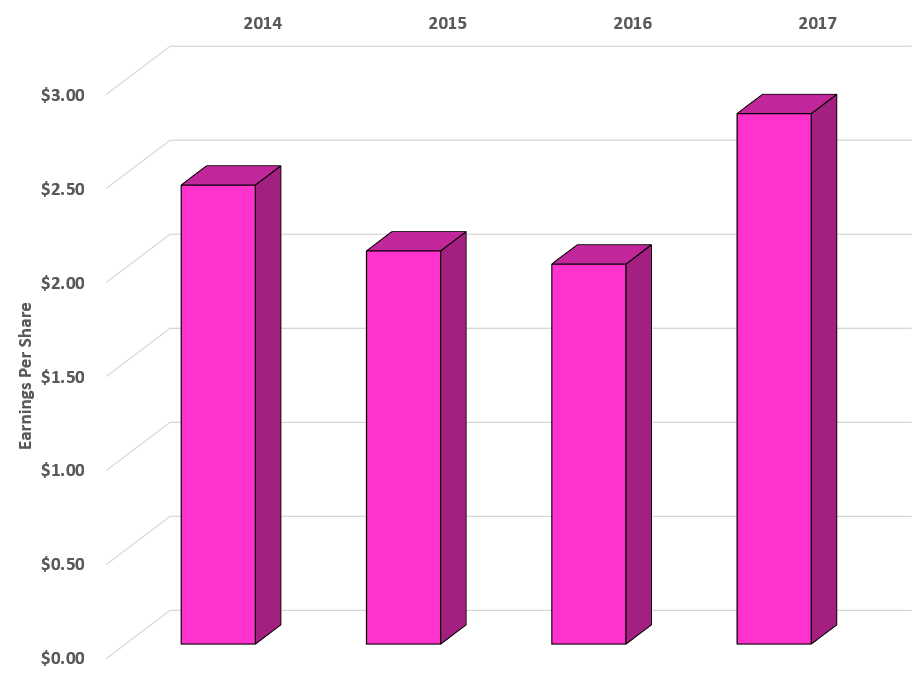
We were pleased to see genuine growth in the Q4 in the more comparable earnings per share figures:

Source: SEC filings, chart made by author in Excel
As you can see, this is a real rebound. What is more, earnings per share for the year turned positive thanks to this great quarter. Adjusted earnings came in at $3.77, much improved from $3.11. We think this will continue in 2018
Our projections for 2018
For fiscal 2018, we are looking for mild improvements in comparable sales, rising 0.25 percent to up 1 percent. That said, because of moves to shutter underperforming stores and to move inventory, we see it likely that total sales will be flat to down 1.5 percent for the year.
Thanks to improved cost efficiencies, a lower tax rate, and continued asset sales, we think adjusted earnings per share will come in between $3.65 to $3.85. As such, earnings could be slightly down, flat, or even up. We will revise estimates accordingly as time moves forward.
All things considered, Macy’s is turning the corner in our opinion. That said, it is not out of the woods yet, but shares have priced in continued gains and have recovered 80% since the lows last fall. We think the momentum will continue.
Quad 7 Capital has been a leading contributor with various financial outlets since early 2012. If you like the material and want to see more, scroll to the top of the article and hit ...
more


Yes. A very small percentage of Macy's customer base accounts for almost half its revenue, indicating that these customers are extremely loyal. Most of those customers are not going to defect to Amazon anytime soon because they love Macy's merchandise and the Macy's experience. And many people still do not want to buy high end apparel online because they want to look at and touch the clothes before buying them.
Macy's is definitely a retailer that has the ingredients to succeed in the Amazon era. it has a significant group of loyal followers and many people do not want to buy upper end apparel online online. Plus, its valuation is still very low. I think Macy's stock will do very well going forward.
Can you elaborate @[Larry Ramer](user:58352)? I don't see how any retailer can compete against the likes of #Amazon. $AMZN $M