

Image Source: Unsplash
Bitcoin is up 2% year to date, but the share price of the world’s largest holder of Bitcoin, Strategy (MSTR – formerly MicroStrategy), is down about 30% year to date. As we have noted in the past, Strategy is a Bitcoin holding company, a leveraged alternative to holding Bitcoin. Its original business, enterprise analytics software, has lost money for the better part of the last ten years. As a software company, Strategy’s value is near zero, or even below zero, since it consistently loses money. However, it owns 641,692 bitcoin, making it the world’s largest corporate holder. Strategy’s Bitcoin is funded with debt and equity. Of note is the approximate $8.2 billion in debt, which must be repaid or rolled over. Given that their Bitcoin is worth approximately $61 billion, debt holders are in a good position. But, Bitcoin holders are getting a little wary.
Michael Saylor, CEO of Strategy, has repeatedly said the company will never sell its Bitcoin. That may be true, or it could be a marketing ploy. The Bitcoin market is starting to consider that Saylor might have to sell Bitcoin to meet preferred dividends or debt maturities. While the selling amount may be minimal, the potential that a huge self-annointed “HODL” investor is selling could be what is weighing on Bitcoin. HODL is slang for those investors who refuse to sell an investment despite drops in value that might scare other investors into selling. Might other HODL investors be rethinking their strategy and selling before Strategy?
Given that crypto has been a poster child for excessive speculation, the space warrants close watching because it is bleeding into other speculative assets, such as gold and AI-related technology stocks. The graph below, courtesy of SimpleVisor, compares the year-to-date performance of Bitcoin (IBIT) and Strategy (MSTR).
(Click on image to enlarge)

Market Trading Update
Despite the sharp selloff in leadership sectors, the broader technical picture remains constructive, although fragility persists beneath the surface.
On Friday, the market closed well off its opening lows, with the market holding support at the 50-day moving average (DMA) as buyers stepped in once again to “buy the dip.” Overall, despite the consistent bearish drumbeat of headlines this past week, the S&P 500 remains within striking distance of all-time highs, and its primary moving averages are trending bullishly. The market remains in an uptrend from the April lows. While the broader bullish case remains intact, investors should monitor the subtle rise in volatility (as indicated by the VIX). As we saw at the beginning of the year, the VIX had bottomed and then began trending higher, along with more significant market swings, until the breakdown in late March and April. We are again observing the same pattern of a rising VIX trend, accompanied by more volatile market behavior.

Market internals remain very weak. As shown, the number of stocks signaling a “strong buy” is dropping sharply, while those technically triggering “strong sell” signals are rising. Furthermore, the percentage of stocks trading above key moving averages continues to decline. While these measures do not mean a crash is imminent, it does suggest that investors remain a bit more cautious with their risk exposures.

Lastly, decliners outpaced advancers even on days when the S&P 500 held up, indicating that performance is once again narrowing rather than broadening, as momentum indicators rolled over sharply in technology, communication services, and semiconductors. As noted above, the factor rotation was especially striking. High-beta, high-momentum, and growth-at-any-price factors all suffered some of their worst relative performance in months. Meanwhile, traditionally defensive sectors like healthcare, utilities, and consumer staples outperformed, a reversal that historically occurs at inflection points, not in the middle of a strong bull market.
A few additional technical observations are worth noting:
- Bitcoin’s correlation with high-beta tech spiked, reinforcing the idea that the selloff was liquidity-driven rather than thematic.
- Small-cap underperformance widened, with the Russell 2000 breaking down relative to the S&P 500—a signal often indicative of risk aversion in the early stages.
- Several widely watched AI stocks triggered short-term momentum sell signals, breaking below medium-term trend channels for the first time since spring.
Support and Resistance Levels
- Primary Resistance: ~6,850–6,900 (top of the rising trend channel and previous highs)
- Initial Resistance: ~6,794 (approximate 20‑day moving average)
- Initial Support: ~6,704 (approximate 50‑day moving average)
- Primary Support: ~6,527 (100-day moving average)
- Critical Support: ~6,148 (200-day moving average)
The bull trend remains intact, but as noted, the character of the market is changing. Last week’s coordinated risk-off event was the first real sign that tech’s dominance is no longer unquestioned. This is not a reason to panic, but it is a reason to tighten risk management, reduce concentration risk, and prepare for an environment where leadership becomes more rotational and less predictable.
The Week Ahead
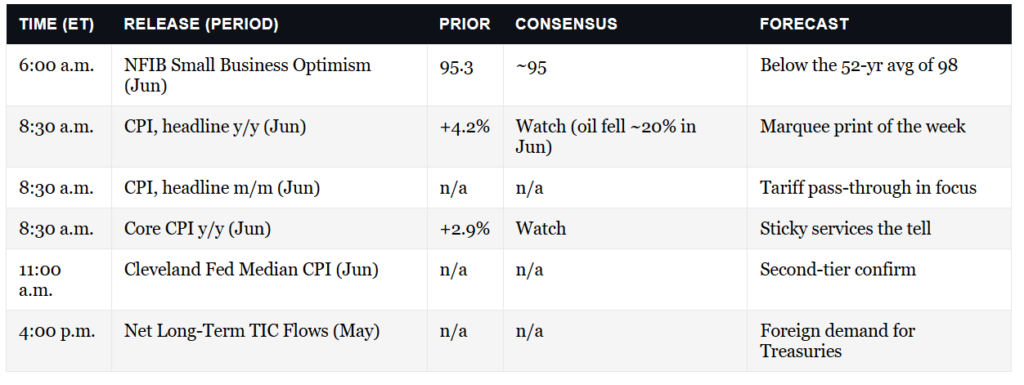
Wednesday will be the most important day of the week for market news. At 2 pm ET, the Fed will release the minutes from its October meeting. With the market pricing in a 50/50 chance of a rate cut, the minutes may provide better clarity on what they may or may not do. Further, they will likely shed more light on the rationale for the abrupt halt to QT and provide clues about when some form of QE could begin.
After the close, Nvidia will report earnings. The market has high expectations, and Nvidia will likely meet or exceed the forecasts. However, as we have seen with Palantir and Meta, which also handily beat expectations, investors may sell good news.
Economic Reacceleration: A Contrarian View
Over the past two weeks, we’ve addressed a persistent question: if the data signals weakness, why hasn’t the recession arrived? In “Slowdown Signals: Are Leading Indicators Flashing Red?” we examined the cracks forming beneath the economy’s surface. From deteriorating leading indicators to credit stress and cooling employment metrics, the evidence supported a cautious stance. In the follow-up, “Promised Recession … So Where Is It?”, we explored the tension between these bearish signals and the market’s resilience. Economic risk has not disappeared, but the timeline for a downturn has stretched further than most expected.
Both articles’ tone was analytical but precise: the economy has not escaped danger. Leading economic indicators flash warning signs, from the Conference Board’s LEI to the ISM Manufacturing Index. Credit conditions remain tight with delinquencies on the rise, and employment trends, while stable on the surface, have started to weaken in rate-sensitive areas.

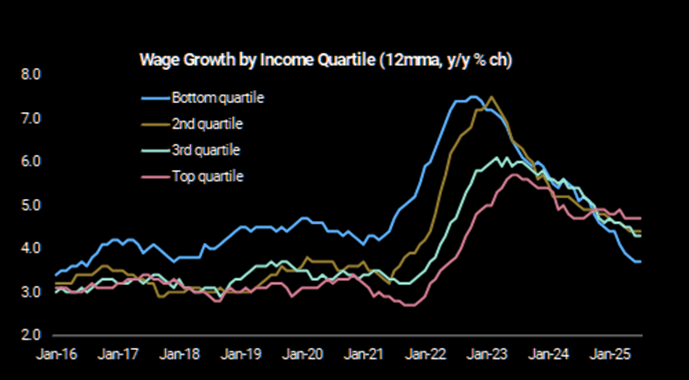
The consumer, long the backbone of the post-pandemic recovery, shows signs of fatigue. Excess savings have dwindled, credit card usage is climbing, and real wage gains have slowed. These are not signals of strength, but of late-cycle fragility.
Yet, despite these risks, the economy has not broken. The recession expected by most economists, strategists, and market commentators has yet to arrive. The S&P 500 continues to grind higher. Volatility remains muted. Consumer spending, while uneven, has not collapsed. And corporate earnings, though pressured in some sectors, have not cratered.
Tweet of the Day

More By This Author:
QE Is Coming: The 2008 Roots Of Fed Dominance
Nvidia Deals: Round Tripping Or Vendor Financing?
CAPE Valuations: Does Nvidia Overstate Its Ominous Warning?


Comments
Log in or sign up to join the conversation.