
Not that long ago, bond yields were rising as concerns over deficits, inflation, and a series of bad Treasury auctions were paraded through the media. We bring this to your attention as the Ten-year Treasury auction on Wednesday was on the weaker side, yet the bond market reaction was minimal. Additionally, government deficits are just as problematic today as they were in May when the 30-year Treasury bond hit 5.15%. In May, when yields were peaking and bond market narratives, such as the bearish bond sentiment, were spreading fear of much higher yields, year-over-year CPI was 2.37%. Today it’s a touch over 3%.
Since May, bond yields have fallen by about half a percentage point, yet inflation has moved higher, and there doesn’t seem to be an end to excessive government spending. Furthermore, the Fed has been conducting QT, which drains liquidity and leaves the supply of Treasury bonds higher than it would otherwise be. What this tells us is that the bearish bond narrative has lost its steam. As we wrote in January:
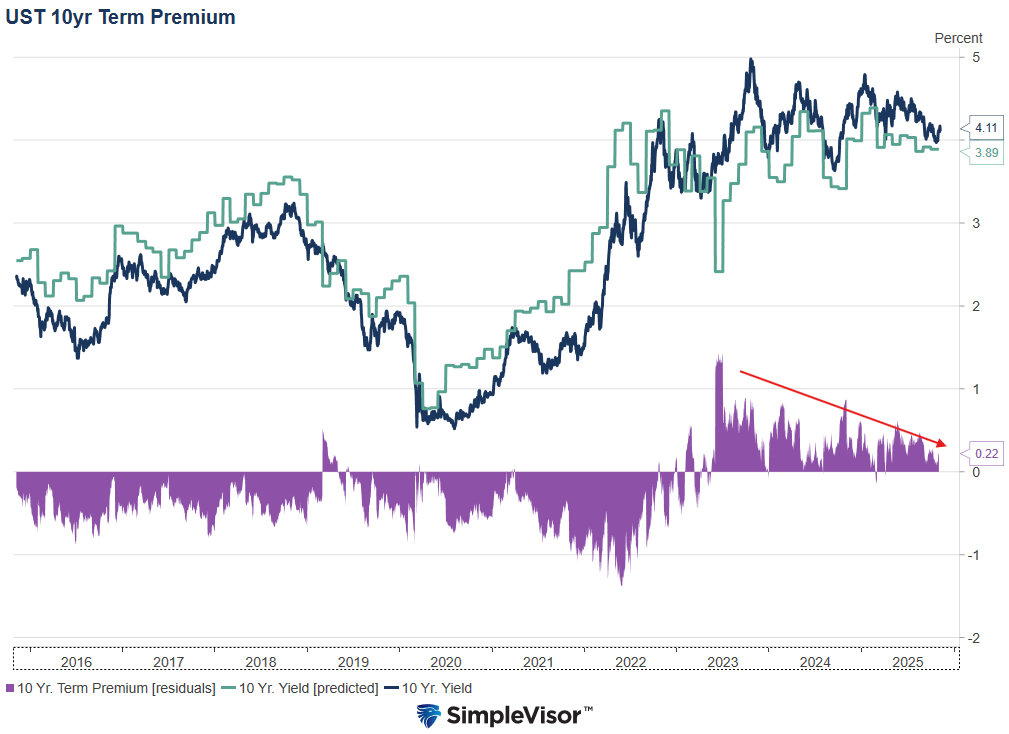
Bond investor sentiment does impact yields and can be relatively accurately quantified, unlike the stock market. In bond market parlance sentiment is called the “term premium or discount.”Quantifying the term premium or discount and, equally important, understanding the market narratives responsible for the premium or discount is valuable. With such knowledge, one can assess whether the narratives make sense. Thus, is the premium or discount likely to be sustained? If the narrative(s) are illogical, there could be an opportunity to profit when the premium or discount normalizes.
The graph below shows that the term premium (purple) has steadily declined, suggesting the narrative, particularly the bearish bond sentiment, is less impactful than it was.
What To Watch Today
Earnings
- No notable earnings releases today.
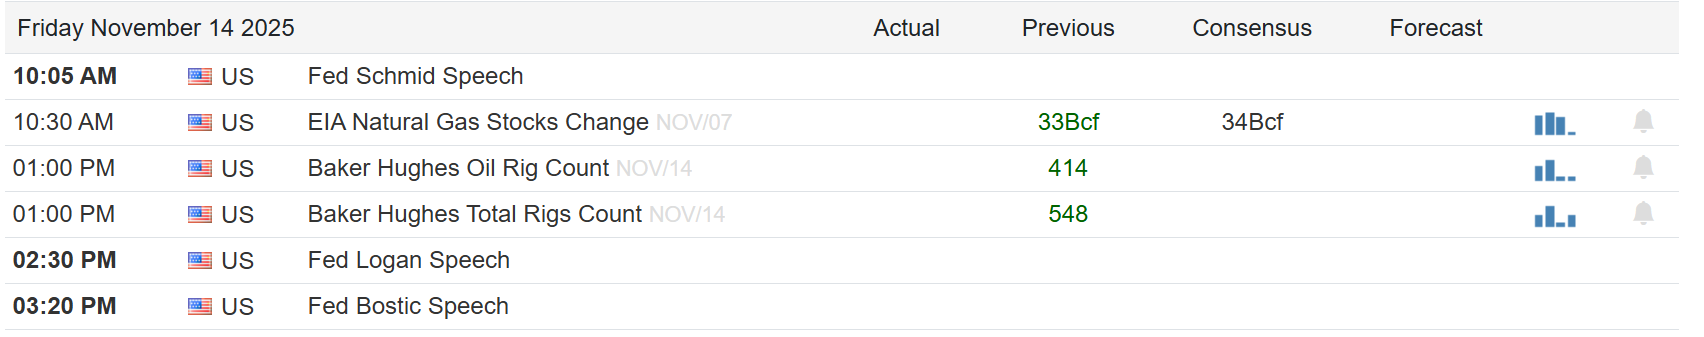
Economy
(Click on image to enlarge)
Market Trading Update
Yesterday, we discussed the ongoing market rotation happening with money moving out of technology and into more defensive areas of the market, like healthcare and financials. However, the bigger concern remains the conundrum of “bad breadth” and markets near all-time highs.
Yesterday, Sentiment Trader had a good note out on this issue, to wit:
“The original NYSE HiLo Logic Index was created by Norman Fosback in 1979. Intended as a way to observe “split” market conditions, it looks for times when there are both a large number of 52-week highs AND 52-week lows among securities on the exchange. When there are a lot of both, the market is severely split between winners and losers, and it tends to be a negative for stocks. When the number is very low, the market is heavily one-sided, which tends to be positive for stocks. The indicator is traditionally interpreted over a longer time frame, so we suggest viewing it with a 10-day moving average.
For our test, we apply the same concept to Nasdaq data an
d use the Nasdaq Composite Index (COMP) as our broad measure of OTC stocks. The chart below highlights all dates in the last 20 years when the NASDAQ Hi/Lo Logic Index 10-day average crossed above 2.5.

While not every indication led to an immediate market reversal it is worth noting that sometimes it does. The question is knowing the difference between the two.
“However, as Sentiment Trader notes, the first table below summarizes the Nasdaq Composite performance following the signal dates highlighted in the chart above.“

“Several key points are worth noting from the tables above. First, overall performance following 10-day > 2.5 signals has been notably below average, with a lower Win Rate and Median Return across all time periods shown above.
The other thing to note is that the overall message is not necessarily “SELL EVERYTHING”, but rather “Adjust your expectations and prepare mentally and portfolio-wise for a) a period of potentially much higher volatility and/or b) an extended period of sideways to lower price action.”
That last point is crucially important to long-term outcomes. The market is going to have volatility, otherwise, there would be no market. The goal is to stay invested, but manage your risk exposure accordingly.
As Sentiment Trader concludes:
“The good news is that none of the signals above are automatic “sell” signals, and there are instances when the stock market performed very well in the future.
The stock market has enjoyed a massive rally since bottoming out in April 2025. After such an advance, it is common for a majority of investors to become complacent and expect that type of performance to continue. Historically, it typically does not. The signals highlighted above should not be viewed with a sense of panic or dread. They merely alert you to the possibility that the stock market may get much more volatile in the months ahead, and that making money may become more difficult, and that you should adjust your thinking – and possibly your portfolio – accordingly.”
With that, we could not agree more.
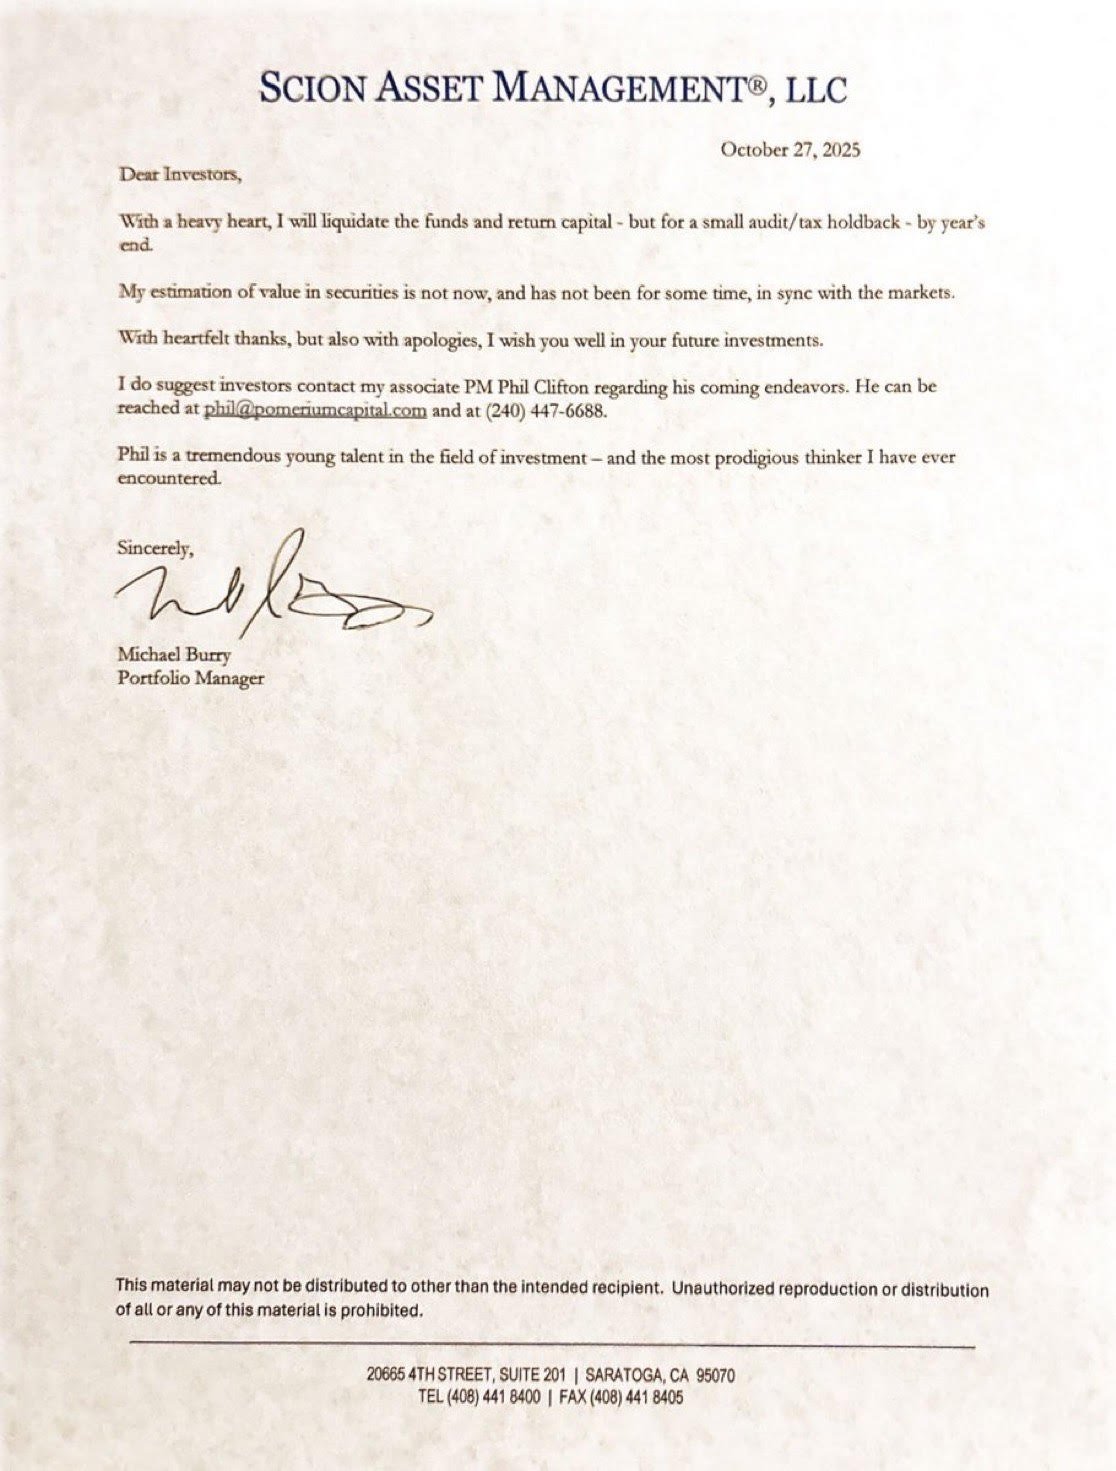
The Big Short Shuts Down
Michael Burry, famed for predicting the 2008 housing/subprime crash and his likeness played a lead role in Michael Lewis’s book and movie The Big Short, is exiting his hedge fund, Scion Asset Management. Recently, he deregistered with the SEC and sent the letter below to his clients.
Scion only managed $155 million as of their last reporting date. While his hedge fund was small, his social media presence was significant. Recently, Burry has been pointing out that the depreciation periods some of Nvidia’s clients are taking for their chips are much longer than the chips’ useful lives. Doing so inflates earnings by decreasing expenses. Per Benzinga, he estimates that Oracle’s profits could be overstated by 26.9% and Meta’s by 20.8%. Furthermore, he recently hinted at more details in a forthcoming disclosure on November 25 amid his broader bearish bets, including short positions on Nvidia and Palantir and a discussion of bond issuance by Meta and Google.
Healthcare Stocks Rebound: Which Sector Is Next?
For a good chunk of this year, healthcare stocks lagged the broader S&P 500. In fact, on July 22, we wrote a Commentary titled Will The Healthcare Sector Be The Next Rotation? In that article, we wrote:
As shown below, the P/E ratio of the healthcare sector compared to the S&P 500 is the lowest it has been in the last 30 years. Moreover, its absolute P/E is in the lower third of readings over the past 30 years. The sector is also very cheap and very oversold on a shorter-term technical basis.
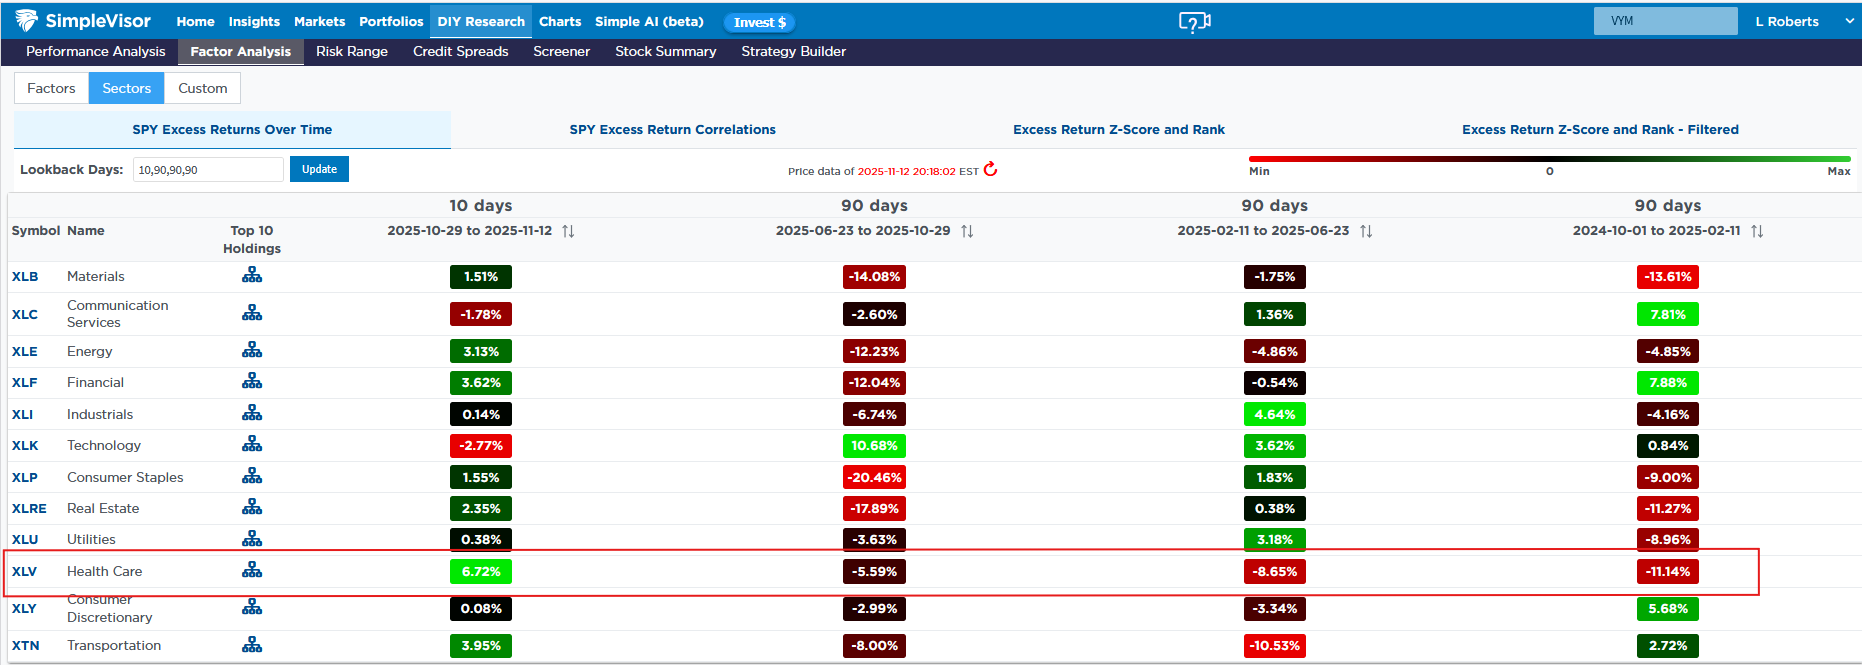
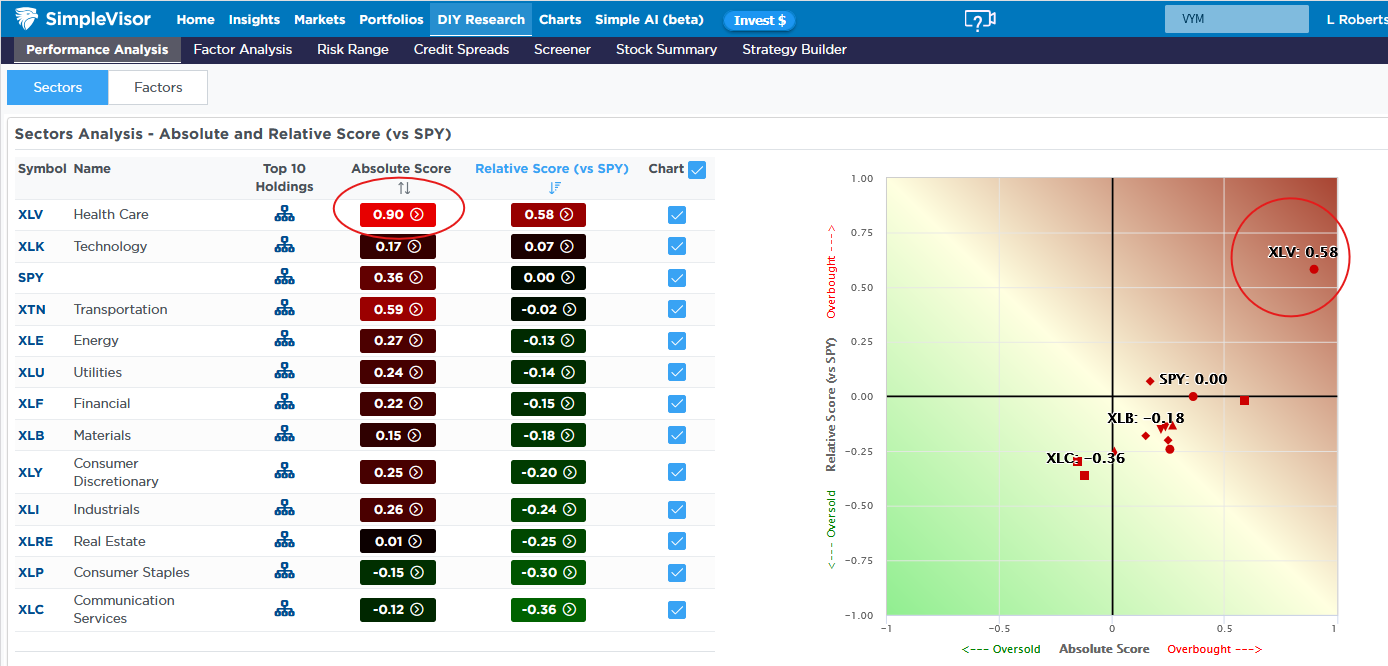
The answer to our article is yes, healthcare stocks have recently rotated into favor. The Simplevisor table below shows the relative performance of each sector versus the S&P 500 over the last 10 days and in 90-day increments going back to late 2024. As shown, healthcare stocks have outperformed the market by 6.72% over the last 10 days. Further, the graphic below the table shows that recent buying in healthcare has brought its absolute score to .90, which is a very overbought level. While the sector may consolidate on both relative and absolute terms, it still has significant room to catch up with the broader market. Compare the recent 10-day returns in the table to the prior three sets of 90-day returns for context.
Are the staples, financial, or energy sector next to follow the healthcare lead and play catch-up?
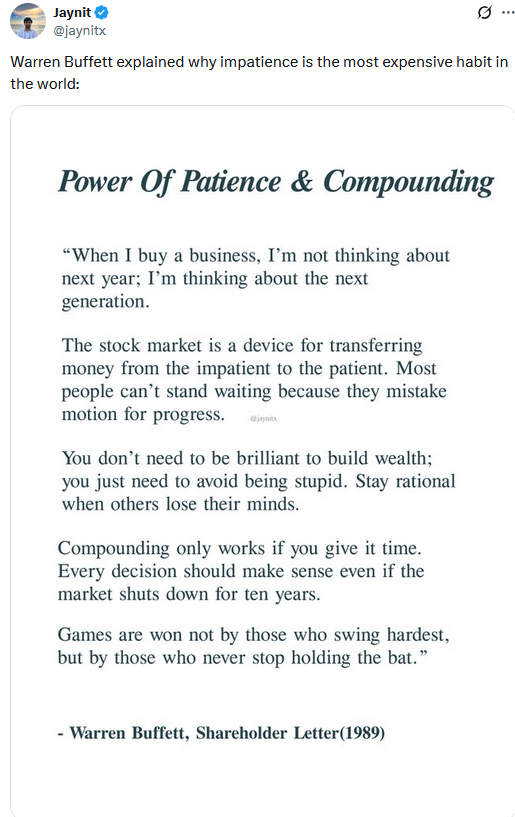
Tweet of the Day
More By This Author:
Data Center Debt: Can Oracle Hang With The Big Boys?50 Year Mortgages: Pros And Cons
An Economic Data Flood Is Coming: Does It Matter?


Comments
Log in or sign up to join the conversation.