
There is a growing divergence of views among FOMC members. Some remain dovish, favoring more rate cuts. Their argument is based on a belief that inflation will continue to move toward the 2% target and that the weakening labor market benefits from lower interest rates. On the other side of the aisle are hawkish views. Unlike the doves, they are concerned that inflation could become entrenched at 3% or higher. They do not view the recent weakness in the labor market as overly concerning. The divergent opinions can result in mixed messages from the Fed. As a result, the market was expecting a “hawkish easing.” Was the tone of yesterday’s meeting hawkish, less dovish, or even more dovish?
As we share below, the Fed made very few edits to the prior statement. Given so little has changed, it’s hard to say the Fed has become hawkish. Moreover, as we circle below on the left side, the Fed will begin purchasing Treasury Bills to expand its balance sheet by $40 billion a month and provide the markets with liquidity. Despite what they may or may not call it, it’s QE. QE is dovish. Given that they stopped QT on December 1 and restarted QE, we would have to characterize the statement as more dovish. Yesterday’s policy change was undoubtedly not a hawkish cut as many expected.
During the press conference, Chairman Powell alluded to the labor market continuing to weaken and his belief that excess inflation is mainly due to tariffs. In fact, he claims inflation would be near 2% if not for the temporary impact of tariffs. His message appears slightly more dovish than at the previous meeting. Based on the statement, QE, the press conference, and the Summary of Economic Projections (SEP) discussed below, we characterize the Fed’s policy stance as more dovish. It’s worth noting that there were three dissenting votes: one in favor of cutting by 50 bps and two hawkish votes in favor of keeping rates unchanged.
(Click on image to enlarge)

What To Watch Today
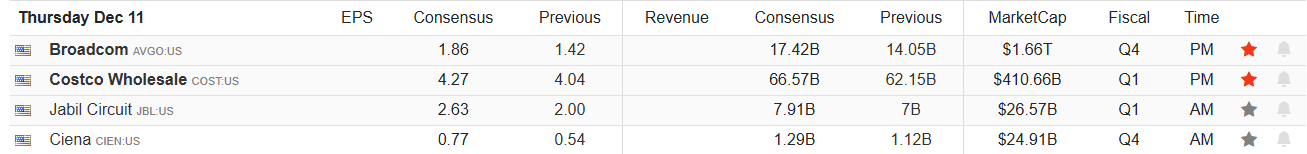
Earnings
(Click on image to enlarge)
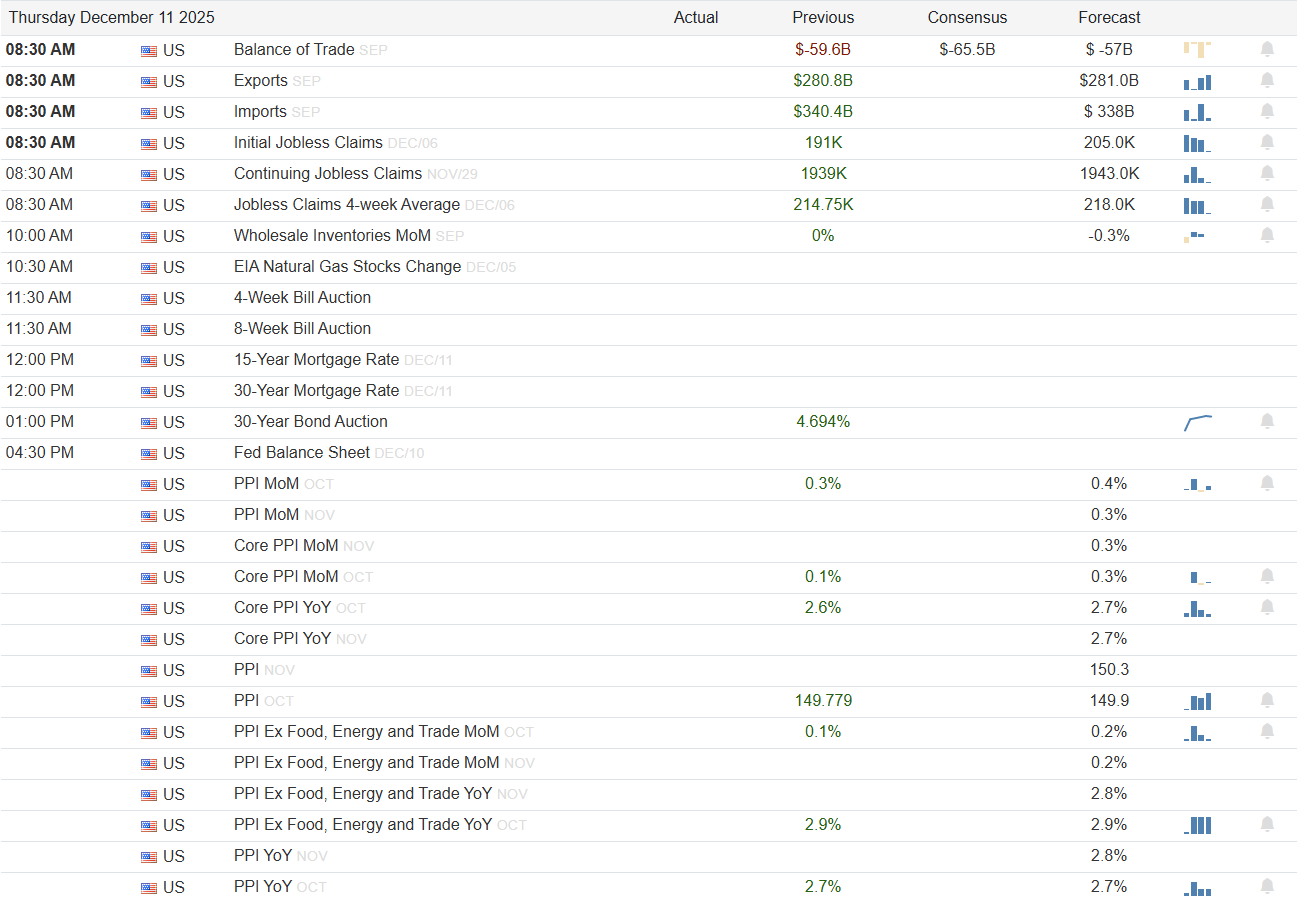
Economy
(Click on image to enlarge)
Market Trading Update
In yesterday’s commentary, we discussed the bullish aspect of very negative consumer sentiment. One thing we are increasingly considering is what may surprise investors next year. That surprise may come from a rotation toward value stocks, which appears increasingly likely based on historical trends, market dynamics, and macroeconomic shifts. Value investing has a long track record of outperforming growth over full market cycles. Over the past century, value has consistently delivered more substantial risk-adjusted returns, especially after periods of extended growth outperformance. Today, many value stocks trade at wide discounts relative to growth peers, creating a potential margin of safety that appeals to investors seeking more stable earnings and lower valuation risk.
That analysis is supported by examining the relative performance of growth versus value over the last several years.
(Click on image to enlarge)

Market conditions also support this shift. Value stocks tend to outperform in environments marked by higher or volatile inflation and more normalized interest rates. After the rate hikes from 2022 to 2024, the economy may be entering a phase of moderate inflation and stable rates. That backdrop typically benefits sectors like industrials, financials, and energy — all staples of value investing. These sectors have lagged behind tech over the last decade, but stronger earnings and lower valuations could set the stage for a comeback.
Furthermore, investor sentiment adds weight to the argument. Growth’s rally has been concentrated in a handful of mega-cap tech names, raising concerns about valuation bubbles and concentration risk. If sentiment shifts away from these over-owned names, capital could rotate into undervalued segments of the market, leading to broader participation that would support a more balanced and sustainable bull market.
Lastly, valuation spreads between growth and value are wide. As of early 2025, the forward P/E ratio for growth stocks hovered around 28, while value stocks traded closer to 17. Historically, such spreads have preceded periods of mean reversion, favoring value. If historical patterns repeat and the macro backdrop remains steady, value may outperform growth over the next 12 to 24 months.
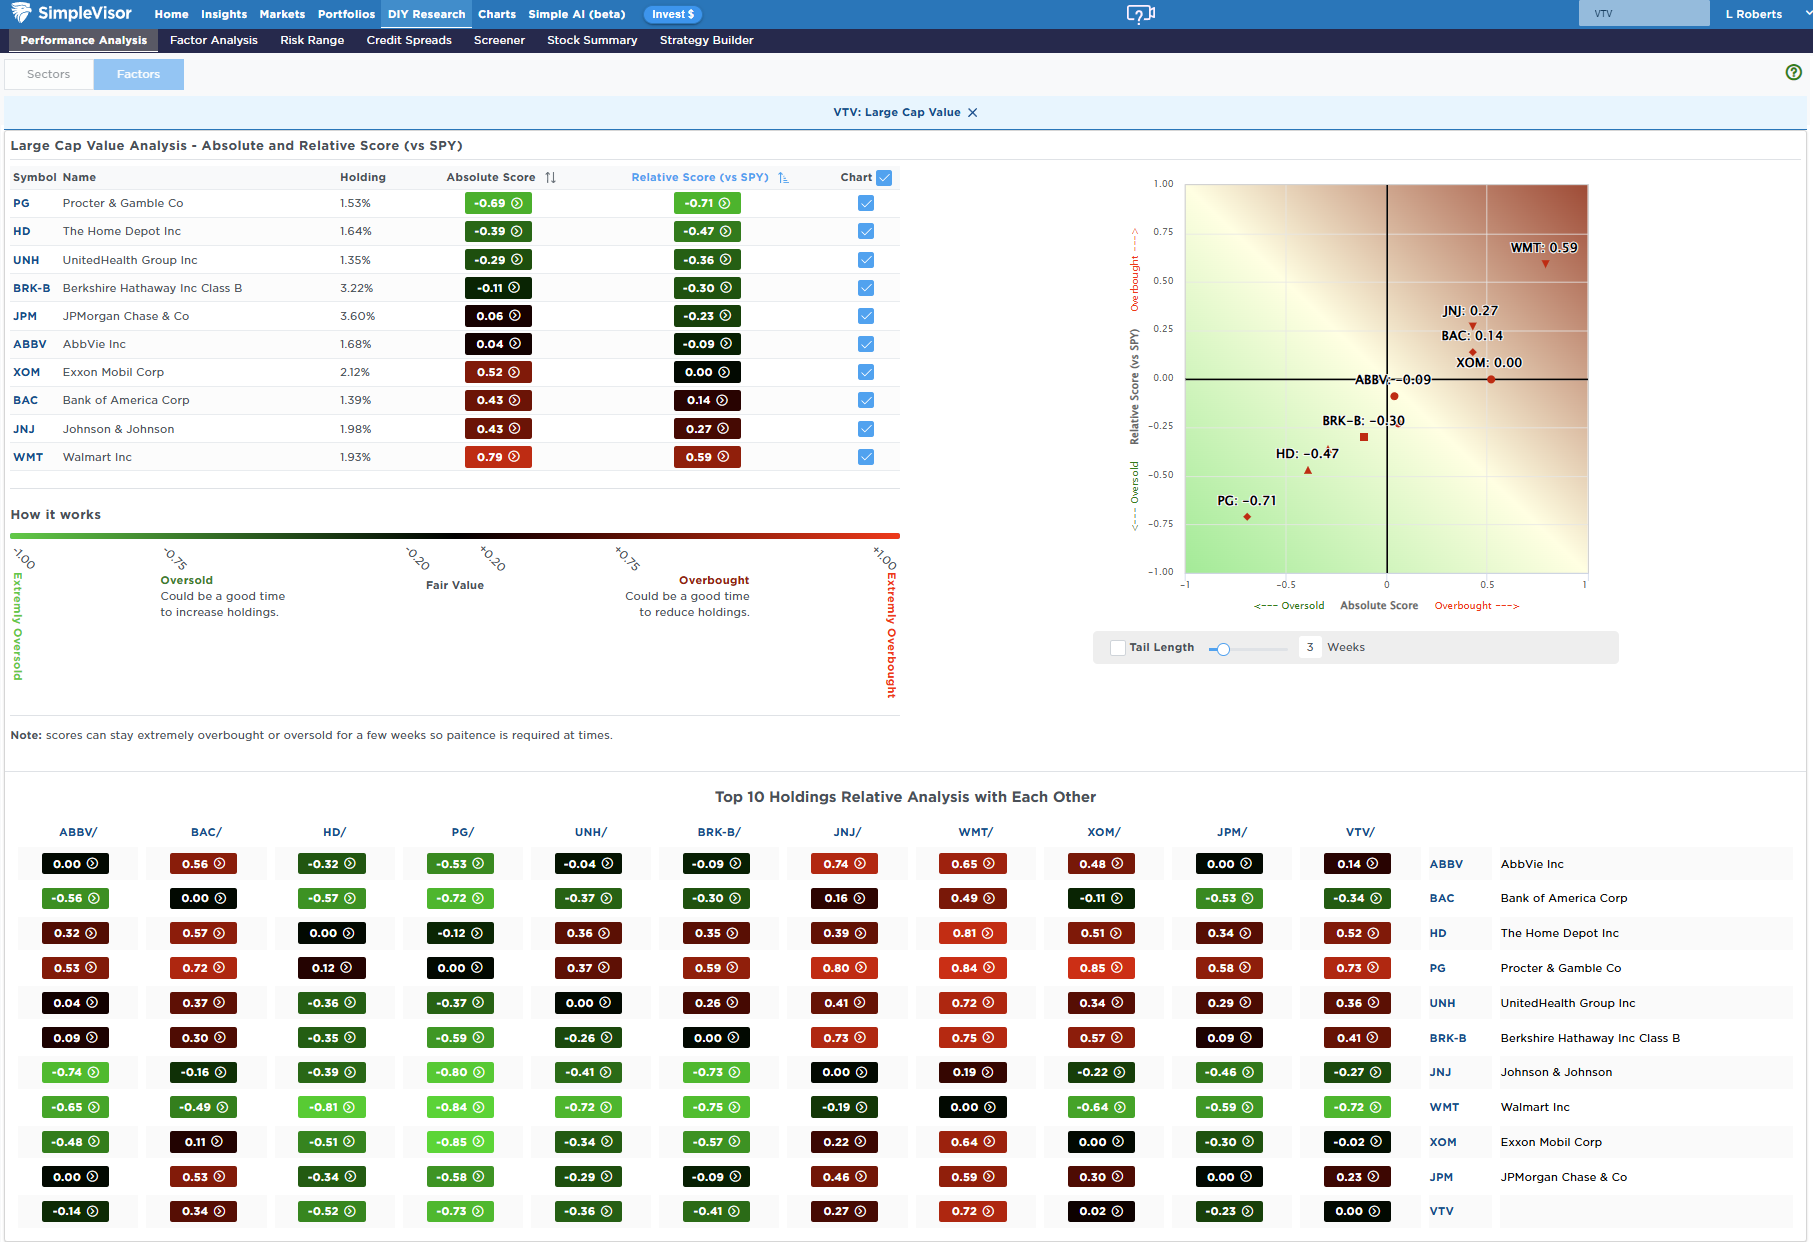
Digging down into the Large Cap Value ETF, we see a notable divergence in performance among holdings, with consumer staple stocks being the most oversold in the index.
(Click on image to enlarge)
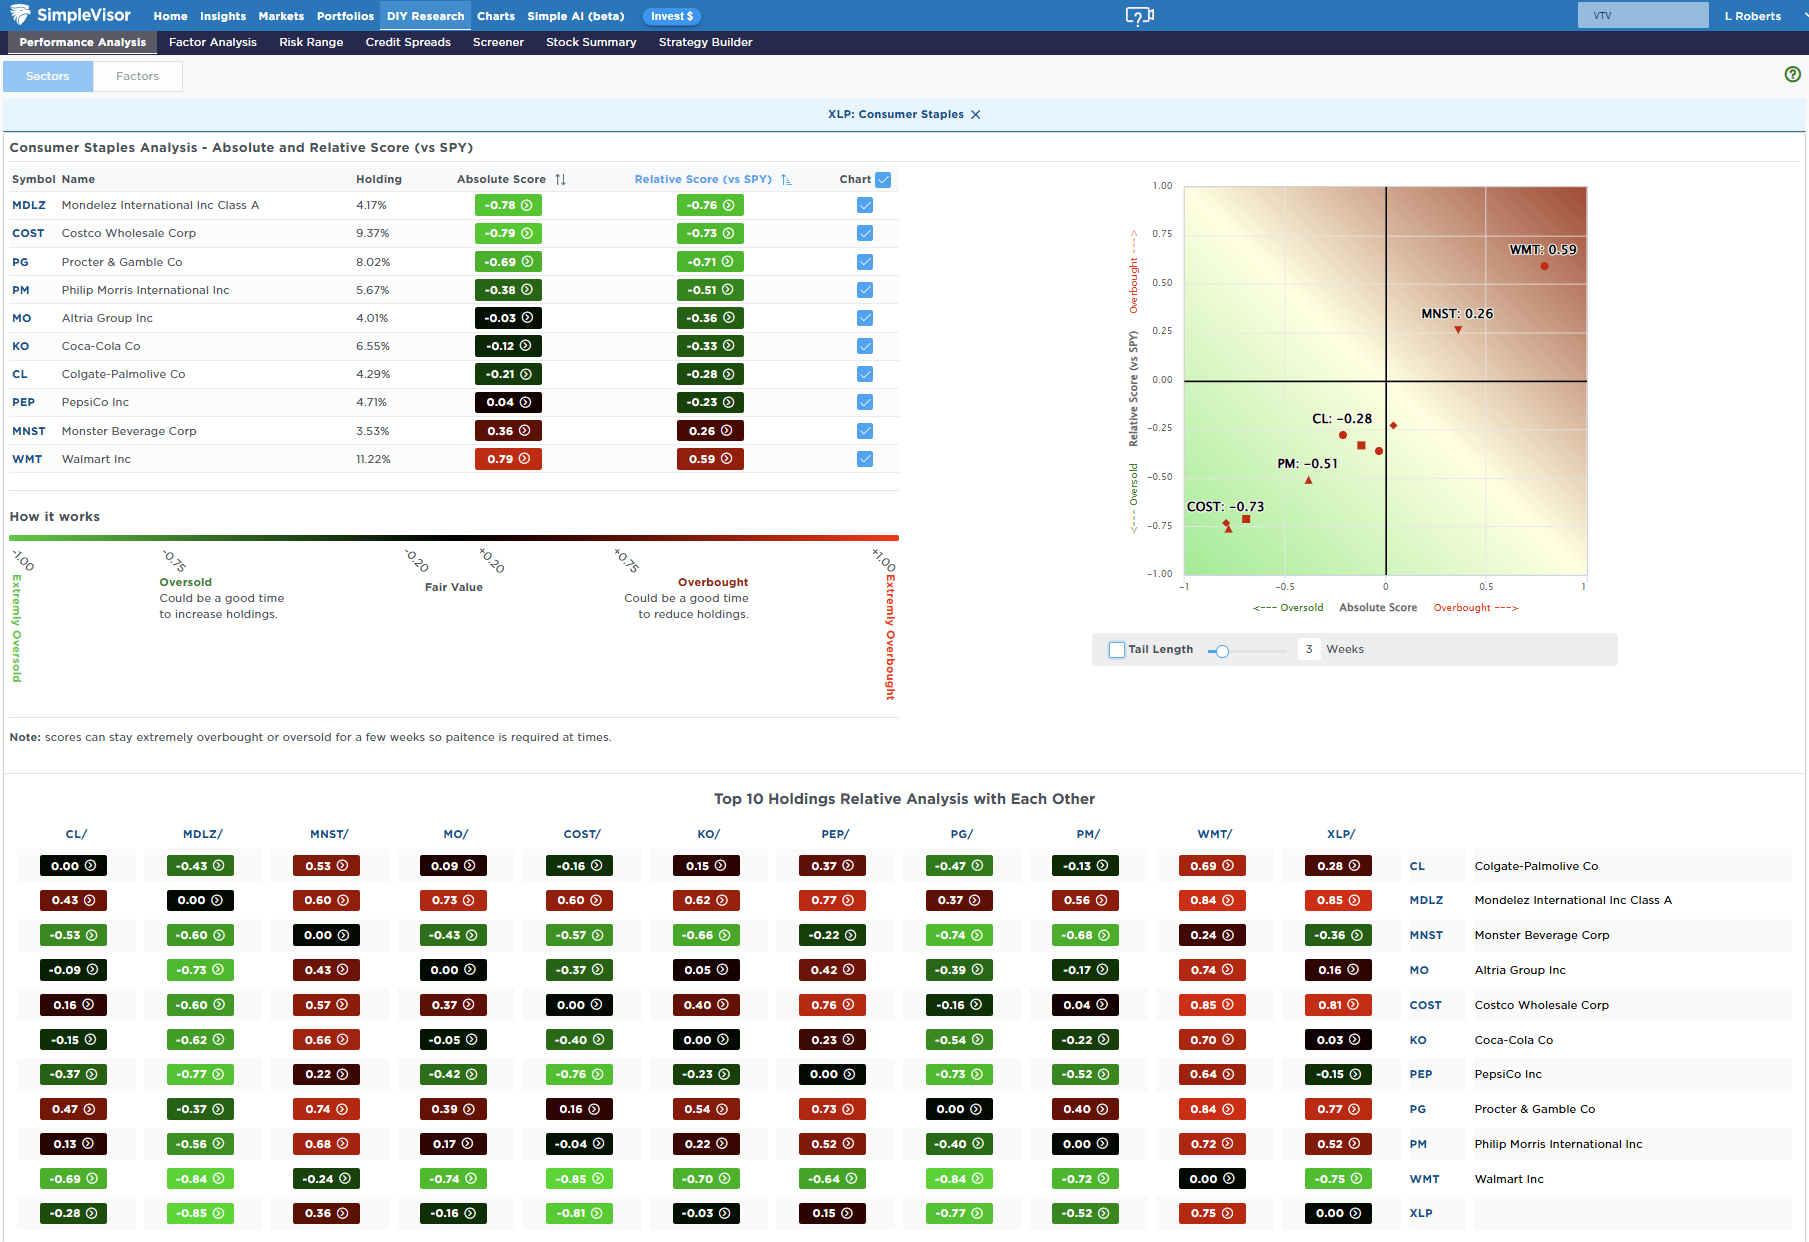
With Staples showing some of the most significant lag relative to growth, an examination of the Staples ETF top holdings provides some interesting ideas to explore further heading into next year.
(Click on image to enlarge)
What causes the rotation in value is always uncertain, but the backdrop of the market, as noted above, is more conducive to such a rotation. Given that Staples, Utilities, and Real Estate have solid earnings growth, substantial dividends, and lower volatility, adding some exposure to your portfolio now could protect you against a more volatile market next year.
Just something to consider.
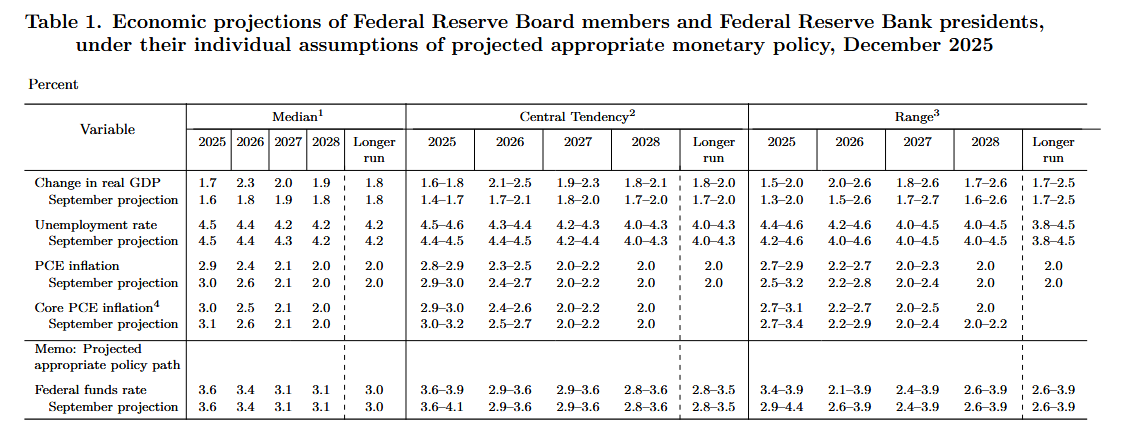
Fed’s Summary Of Economic Projections (SEP)
On a quarterly basis, the FOMC polls its members for forecasts on where GDP, unemployment, inflation, and the Fed Funds rate will be at the end of the current year, as well as the following three years and the “longer run.” The SEP is also referred to as the Fed dot plots, as each member’s projection is plotted on a scatter plot, as we share in the second graphic.
Of note:
- The forecast for GDP growth next year rose sharply from 1.8% to 2.3%
- PCE and Core PCE inflation were lowered by one and two-tenths, respectively, for 2026.
- The Fed thinks inflation will fall back to its 2% target by 2027.
- They forecast that unemployment has potentially peaked at 4.5% and will inch down over the next year.
- Fed members are only expecting to cut rates once next year on average. However, the range of expectations is extensive, ranging from 2.1% to 3.9%.
- Longer-run GDP forecasts have remained at 1.8% for quite a while despite AI and the massive data center expansion. The Fed must not think that AI and productivity gains will benefit the economy.

Affordability Crisis
Michael Green, Chief Strategist and Portfolio Manager at Simplify Asset Management, wrote a provocative Substack essay, Part 1: My Life Is A Lie, that is sparking a debate among economists and raising awareness of the affordability crisis. It’s not just the wonky economists debating the merits of his article; The Washington Post, CNN (News Central), FOX Business (Charles Payne), and social media are also critiquing it.
Michael uses the official poverty line calculation and what he deems the “Mathematical Valley” to help his readers better appreciate why affordability is becoming a hot topic.
Per Michael Green:
But there was one number I had somehow never interrogated. One number that I simply accepted, the way a child accepts gravity.
The poverty line.
I don’t know why. It seemed apolitical, an actuarial fact calculated by serious people in government offices. A line someone else drew decades ago that we use to define who is “poor,” who is “middle class,” and who deserves help. It was infrastructure—invisible, unquestioned, foundational.
This week, while trying to understand why the American middle class feels poorer each year despite healthy GDP growth and low unemployment, I came across a sentence buried in a research paper:
“The U.S. poverty line is calculated as three times the cost of a minimum food diet in 1963, adjusted for inflation.”
I read it again. Three times the minimum food budget.
I felt sick.
This article summarizes Michael Green’s perspective and opposing arguments regarding the poverty line.
Tweet of the Day

More By This Author:
Hassett To Replace Powell: Betting Markets Are Confident
Is Japan In A Death Spiral?: A Contrarian Take
The DPI Link To Margin Debt


Comments
Log in or sign up to join the conversation.